Aegis
Aegis brings together two strategy sleeves. It lets us examine concentration within a smaller combination; fewer components do not establish that a…
Explore →Multi-timeframe price action
A structure-led Expert Advisor that reads candles across multiple timeframes, then uses selected BOS, CHoCH, and supply-and-demand context without depending on conventional indicators.
Scroll the diagram horizontally or open it at full size.
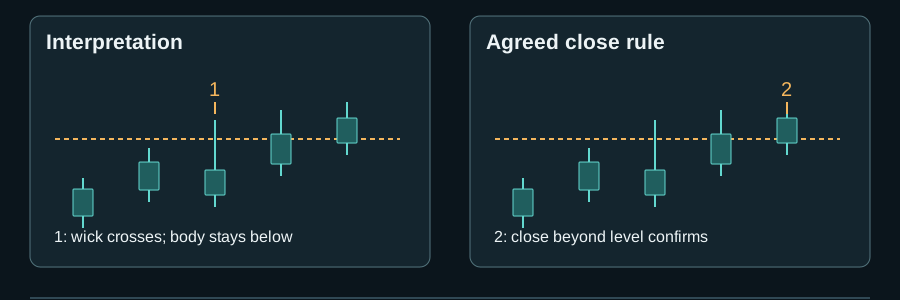
Synthetic candles; the same input is shown twice. Level and close rule are explicit.
Open full diagram ↗Why SMC
We believed that relying only on indicator-driven strategies could not use every opportunity the market can offer. That idea led us to examine whether a widely used price-action approach could be translated into a consistent algorithmic process. The approach was SMC.
After initial research and direct discussion with traders who used the method, we began turning its main ideas into an Expert Advisor. The purpose was not simply to automate familiar labels, but to see whether market structure itself could support repeatable decisions.
Higher-timeframe context
The first implementation did not meet our expectations. We therefore set aside a dedicated development period to refine the model while preserving the core idea.
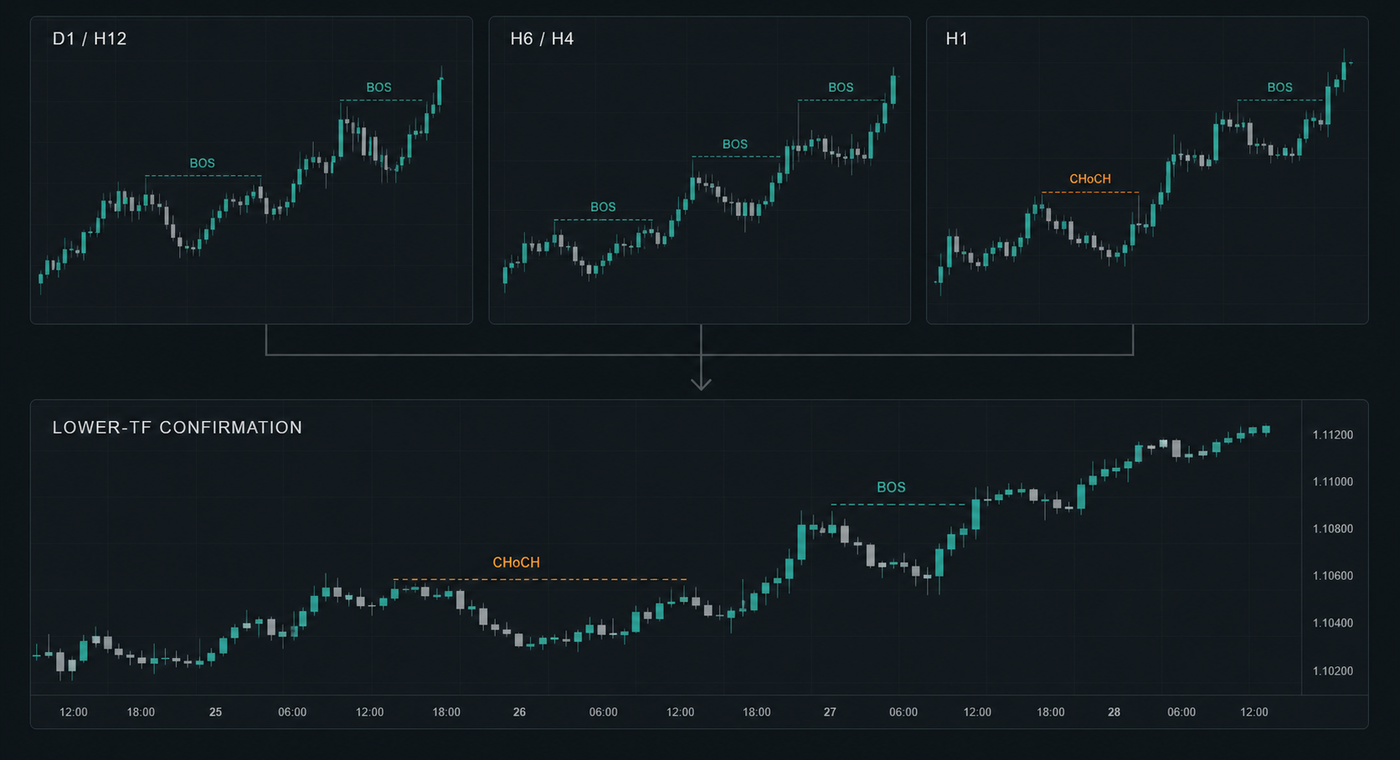
The revised system defines market structure across the daily, 12-hour, 6-hour, 4-hour, and 1-hour timeframes. This helps it address conflicting readings at higher timeframes before that context is passed into lower-timeframe decisions. The structure is read from candles and price movement rather than a conventional indicator signal.
Lower-timeframe confirmation
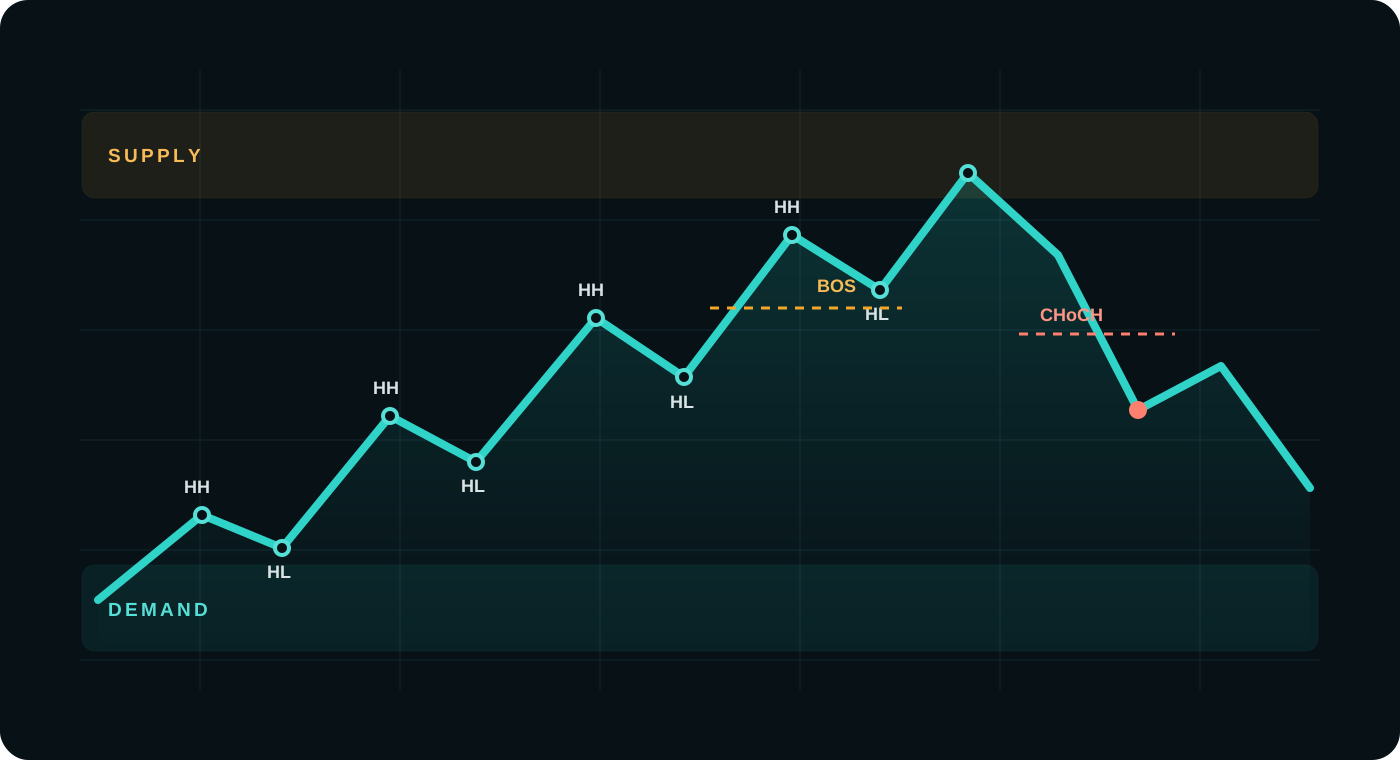
Once the broader structure is established, the Expert Advisor looks for selected and meaningful Break of Structure (BOS) and Change of Character (CHoCH) events at the lower timeframe. Supply and demand areas provide additional location context, because not every apparent break has the same importance.
The public profile intentionally explains the framework without publishing the internal thresholds, validation sequence, or entry rules that would make the system directly reproducible.
Trade framework
As with the other POLARIS systems, the intended risk and expected reward of every position are defined before the trade is placed. The objective is to keep each decision inside a known risk framework rather than allowing an open-ended exposure.
Validation path
After the logical model reached a stable form, it was challenged through long-period historical tests, stress testing, forward testing on data that had not been used during development, and finally a live-market forward test.
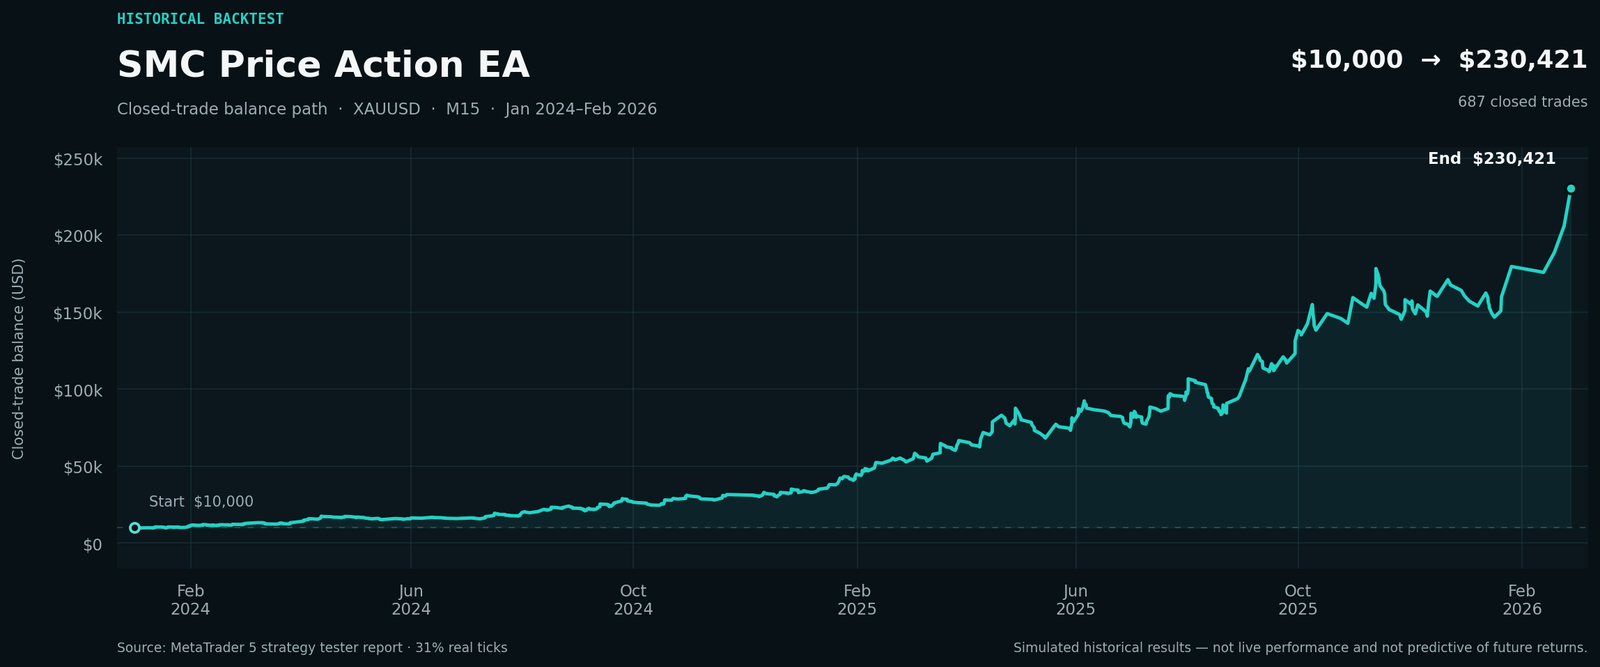
The two records below are kept separate. The historical curve ends in February 2026 so that the final months do not overlap with the six-month live forward-test record.
System evidence
The first chart was rebuilt from the closed-deal history supplied with the MT5 report. The second image is the original MT5 record of the recent live forward test and is shown without alteration.
Historical test
Six-month live forward test
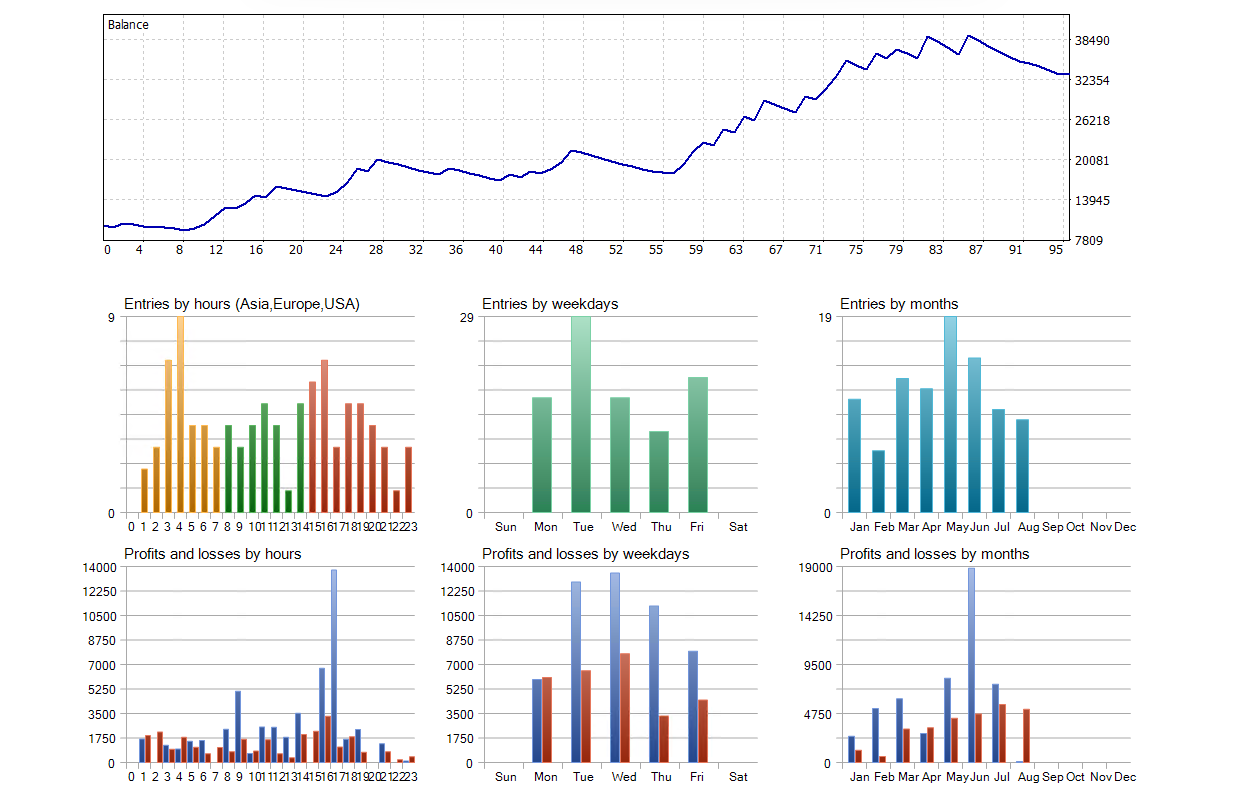
The live image documents the standalone forward test of this EA. It is presented separately from the historical simulation so visitors can distinguish the two forms of evidence.
Portfolio role
Within a portfolio, this Expert Advisor contributes a price-structure perspective. Its decisions begin with candles, market structure, and location rather than the volume logic used by VWAP systems or the price-gap logic used by arbitrage.
That different source of information can make it a useful component beside systems designed for other market conditions, while overall allocation and risk still need to be managed at portfolio level.
Short answers
No. Its main framework is based on candles, multi-timeframe market structure, BOS, CHoCH, and supply-and-demand context.
Higher timeframes define the broader structure. Lower timeframes are used only after conflicting higher-timeframe readings have been addressed.
No. The long curve is a historical backtest, while the original MT5 image documents a separate six-month live forward test.
Questions
Questions about the design or the software specification are welcome. No account-management or portfolio-access offer is made here.
Ask about the research →