Market journeyFrom gold futures to professional algorithmic system development.
POLARIS / Portfolio engineering
We began with trading robots.
We learned to think in portfolios.
Building a robot was only the beginning. Through development work, data preparation and testing, we came to a harder question: how do several systems behave together when market conditions change? Our work now centres on portfolio construction, combined risk and periodic review. Here we explain that journey and the limits we encountered.
</> Independent systems
✣ Risk-budget allocation
◇ Evidence before claims
- Research & development
- Risk allocation
- Strategy evaluation
- Portfolio construction
- Performance review
- Portfolio reweighting
01 / Algorithmic portfolios
Think beyond the single robot.
We moved from individual trading ideas to the relationships between systems. A different name or entry rule does not necessarily mean a different source of risk. That changed what we built, what we measured and what we kept questioning.
Diversified by logic
Components are selected for different hypotheses and market behaviour—not merely different names.
Allocated by risk
A weight affects exposure, not just presentation. We consider position sizing, concentration and drawdown alongside the operational limits of each component.
Built for regimes
Directional, counter-cycle, specialist, and protection layers can respond differently as conditions change.
Reviewed as one system
Exposure, correlation, execution, drawdown, and behaviour drift are evaluated at portfolio level.
02 / Portfolio range
Three portfolio structures. One research question.
How does changing the combination of systems change the questions we need to ask about joint risk? These pages describe our portfolio architecture, not a selection of accounts available for investment.
Defensive portfolioNORMALIZED TRACK RECORD
Aegis
Aegis brings together two strategy sleeves. It lets us examine concentration within a smaller combination; fewer components do not establish that a portfolio is safe.
Not enough history
Recorded weekly data · 02 Oct 2026
- Since start
- +42.25%
- Max balance drawdown
- 9.87%
- 3M return
- +9.19%
- 1M return
- +5.59%
Balanced portfolioNORMALIZED TRACK RECORD
Orion
Orion uses four sleeves to study a wider combination of trading approaches. Adding components changes the review work; it does not by itself demonstrate diversification.
Not enough history
Recorded weekly data · 02 Oct 2026
- Since start
- +50.25%
- Max balance drawdown
- 10.76%
- 3M return
- +11.04%
- 1M return
- +3.20%
Growth portfolioNORMALIZED TRACK RECORD
Nova
Nova uses eight sleeves, including additional gold exposure. A broader architecture introduces more interactions, execution dependencies and concentration questions.
Not enough history
Recorded weekly data · 02 Oct 2026
- Since start
- +50.72%
- Max balance drawdown
- 14.80%
- 3M return
- +10.33%
- 1M return
- +6.02%
iAll three card charts use the same $10,000 baseline and shared vertical scale. They are sampled at Friday end-of-week balance for readability. Published 1M, 3M, since-start and Max Balance Drawdown figures are calculated from the complete normalized closed-position sequence. Historical performance is not a forecast or guarantee.
Explore portfolio architecture →
i Portfolio allocations and evidence must be reviewed with their stated period, account conditions, and limitations.
03 / Systems library
The portfolio begins with its components.
Our system pages explain the trading questions and implementation work behind individual components. Building an EA or indicator remains part of our engineering work, but the portfolio is the organising idea—not a catalogue of supposedly winning robots.
Explore Expert Advisors and trading systems →Gold Spot–Futures Arbitrage EA
A two-market arbitrage Expert Advisor that monitors price relationships between related spot and futures markets. POLARIS currently applies this research to gold.
VWAP Trend Expert Advisor
A volume-aware Expert Advisor designed to follow the confirmed market trend while keeping the risk of every position clearly defined.
SMC Price Action Expert Advisor
A structure-led Expert Advisor that reads candles across multiple timeframes, then uses selected BOS, CHoCH, and supply-and-demand context without depending on conventional indicators.
POLARIS / Research
The difficult part was not writing another robot.
We moved from individual trading ideas to the relationships between systems. A different name or entry rule does not necessarily mean a different source of risk. That changed what we built, what we measured and what we kept questioning.
Turn an idea into rules
We began with strategies, Expert Advisors and indicators. Coding forced us to specify entries, exits and exceptions that a discretionary description could leave open.
Build a usable testing process
We worked on data preparation, backtests and optimisation. We learned to separate parameter selection from later evaluation and to question results that depended on one feed or one favourable period.
Observe execution outside the backtest
Forward, demo and live observations raised different questions about spreads, fills and operational behaviour. We keep those categories separate; one does not automatically validate another.
Examine systems together
We moved beyond comparing standalone profit. We examine when positions overlap, whether losses cluster and how shared exposure can undermine apparently different strategies.
Review weights through rolling windows
Our process includes monthly reviews using moving data windows. We consider risk, concentration and changes in behaviour; review does not mean that weights must change every month or that new weights will perform better.
Use AI as a supporting tool
We explored local numerical models, hosted language-model APIs and chart vision. These were different ways to structure information and study filters, not evidence of automatic trading accuracy or guaranteed improvement.
What investors should ask
Evidence before promises.
A performance number has little meaning without its period, source, account conditions, drawdown, and distinction between simulated and live results.
01
Verified source
State whether evidence is simulated, forward-tested, demo, or live, and identify the relevant period.
02
Drawdown context
Show peak-to-trough behaviour and recovery rather than presenting return in isolation.
03
Execution realism
Broker conditions, spread, slippage, latency, and deposit load can materially alter results.
04
Change policy
Explain when a system may be reduced, paused, replaced, or removed from the portfolio.
05 / Research
Research that keeps accumulating.
Market analysis, economic context, algorithmic-trading education, and periodic system or portfolio reports live in one expandable editorial section.
How a 34% Win Rate Can Still Be Profitable
We revisit a published backtest to explain how the size of winners and losers can matter more than the win-rate headline.
Read research →Why Optimization Cannot Rescue a Weak Trading Idea
We explain how we use optimization to examine a defined idea, and why a winning parameter set still needs a credible explanation.
Read research →From Python Research to MT5 Execution: A Composite Case Study
We use a composite case to explain how research output becomes a timestamped, checkable message that MT5 can accept, reject or ignore.
Read research →AI Lab
Our AI Lab traces the methods we explored, from local models to text APIs and chart vision. It separates development history from claims about trading outcomes.
AI Lab →Historical portfolio comparison
Historical research comparison — not live-account performance or a forecast.
View the historical comparison →Custom development, as a separate service
We can also discuss a clearly scoped EA, indicator or testing tool. A software development request is separate from managing someone’s trading account and carries no promise of trading returns.
Custom EA Development →POLARIS / Behind the candle
All market insights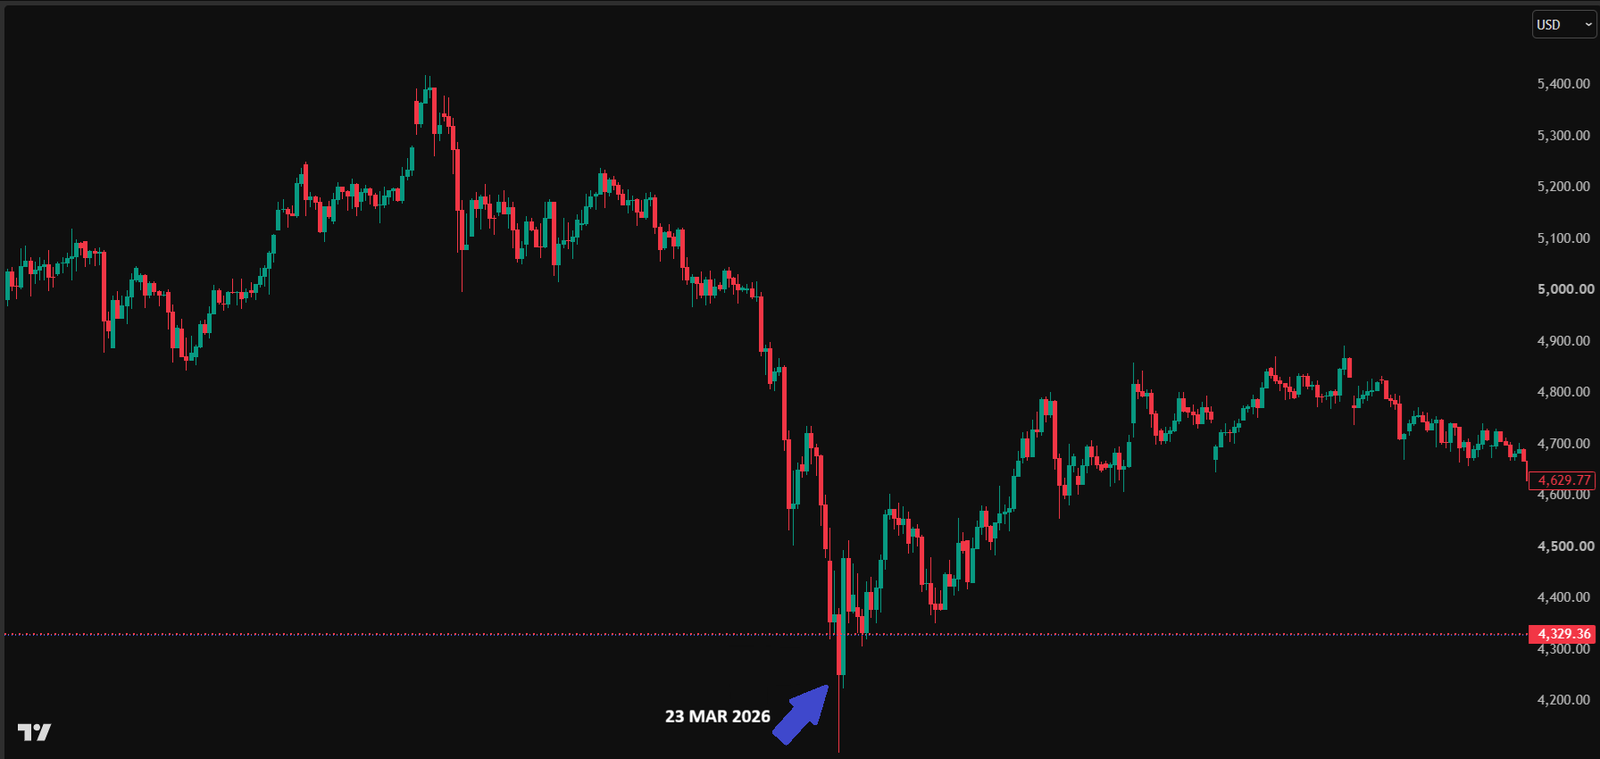 POLARIS ↗
Market Insights XAUUSD
Market session · 23 March 2026
The March 23 Candle That Repriced Gold’s War Narrative
Gold had been sliding as the Iran war pushed oil higher and revived rate-hike fears. On 23 March 2026, Trump’s surprise de-escalation signal forced a rapid repricing across oil, the dollar and gold.
Explore the story06 / About POLARIS
What the long route changed for us
Our development archive contains 170 records covering varied trading-system work. We do not present that count as 170 profitable robots or as a qualification to manage investments. The more important lesson was learning to question the whole chain—from the idea and data to execution and the behaviour of a combination.
Read the POLARIS story →What these pages do—and do not—offer
Can I open or connect an investment account here?
No account-opening, account-connection or investment subscription is offered through this website. Do not send funds, broker credentials, API keys or authority to trade through the contact form.
Does a portfolio remove market uncertainty?
No. Systems can fail together, correlations can change and execution can differ from research assumptions. Diversification, risk limits and monitoring cannot guarantee capital or returns.
Why not describe a managed-account arrangement?
We are not introducing an account-management offer in this edition. Any future service would require a separate review of the legal entity, permissions, eligible jurisdictions and client terms before it could be described or offered.
Can I still ask for an EA or indicator?
Yes. You can ask about a software specification or research question. We would first define the technical scope; that conversation is not an assessment of an investment’s suitability for you.
Contact POLARIS
A research question or an engineering brief?
Tell us which method, article or software requirement you would like to discuss. This channel is not an application for investment or account management. Please do not send financial account details or confidential access information.
Direct conversation
Ask about the research
Questions about the design or the software specification are welcome. No account-management or portfolio-access offer is made here.
Open enquiry form ↗