What the weak NFP report meant for gold
Earlier in August, the employment data gave gold buyers a reason to feel more comfortable. The July US jobs report, released on 7 August, showed a decline of 23,000 nonfarm payroll jobs. Revisions also removed a combined 103,000 jobs from the previous two months. [1]
Reuters reported that gold reached a seven-week high that day as the weak figures reduced expectations of a Fed rate increase. The report had eased one of gold’s immediate pressures, helping the recovery gain momentum. [2]
Gold ETF inflows supported the recovery
Fund flows added another supportive element. The World Gold Council’s July report, published on 6 August, showed US$3 billion of net inflows into gold-backed ETFs, reversing two months of outflows. Holdings increased by 23 tonnes, with Europe leading the inflows. [3]
That was evidence of renewed investment demand. Together with softer payrolls, it gave buyers a plausible recovery narrative: investors were returning while the pressure for higher interest rates appeared to be easing.
What Kevin Warsh said at Jackson Hole 2026
At Jackson Hole on 28 August, Fed Chair Kevin Warsh stressed that inflation remained above the 2% target and that the Fed’s predominant focus should be prices. He viewed the labour market as broadly consistent with full employment and said recent better inflation readings had not convinced him that the underlying trend had meaningfully improved. Further action remained possible; he left the next policy decision open. [4]
For gold, the implication was uncomfortable. Softer employment data offered less protection if the Fed still saw inflation as the more pressing problem.
28 August: the recovery meets renewed selling
XAUUSD / DAILY · D1
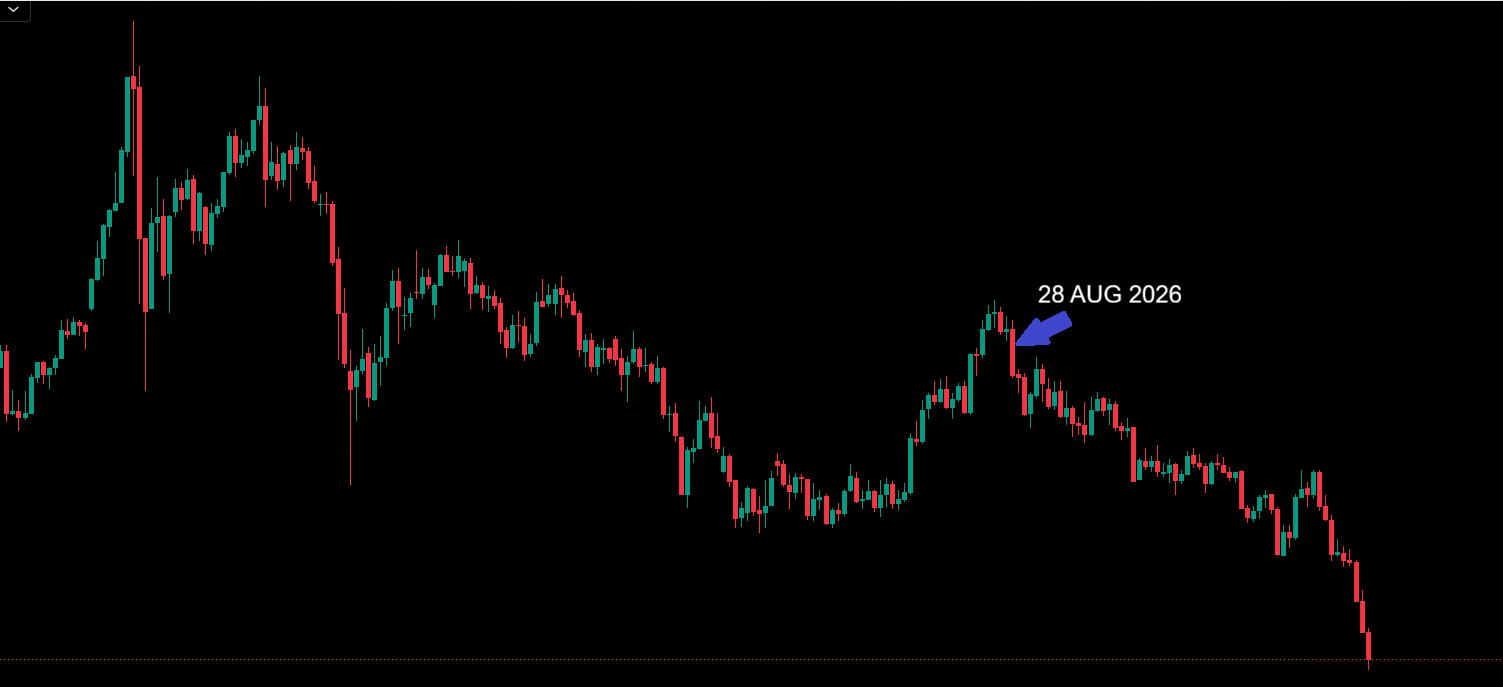
Spot gold · Daily timeframe. The original arrow and date label identify 28 August 2026. A rebound gives way to renewed weakness in the price sequence shown.
Swipe horizontally to inspect the full chart.
How Fed rate-hike expectations changed
Reuters’ same-day gold report recorded the market-implied probability of a September rate hike rising from 36% before Warsh’s remarks to 56% afterwards. Gold reversed lower, while the dollar climbed to more than a one-week high. These were intraday observations, showing how quickly the policy outlook was being reassessed. [5]
The starting probability matters: investors had already recognised a meaningful risk of higher rates. Jackson Hole increased the weight assigned to that risk.
Our reading is that this shift challenged the recovery’s foundation. A higher expected return on dollar assets raises the opportunity cost of holding gold, which pays no interest, while a stronger dollar can add pressure to its dollar-denominated price. [5]
What the XAUUSD daily chart shows
On the supplied daily chart, the marked bearish candle follows a rebound within a market that had already experienced substantial selling. The price sequence to its right shows further weakness, interrupted by smaller recoveries.
Our interpretation is that 28 August marks the failure of that recovery attempt and a renewed phase of selling. The speech and the immediate repricing help explain the turn; the later price action supports the broader bearish reading.
A daily candle groups many hours of trading. It provides context for the change in direction, while the contemporaneous reports establish the immediate market response to Jackson Hole. Explaining the entire subsequent decline would require the news and data that followed.
More from Behind the candle
Compare this episode with earlier analyses of gold and changing market expectations:
Sources & evidence
- BLS — The Employment Situation, July 2026
- Reuters — Gold hits seven-week high as weak US jobs data dents rate hike bets
- World Gold Council — Gold ETF Flows: July 2026
- Federal Reserve — Kevin Warsh, “In Our Time”
- Reuters — Gold drops over 1% as Fed’s Warsh comments lift rate hike bets
Retrospective market analysis for educational purposes. Chart supplied by POLARIS.