The war shock changed the backdrop, not the verdict
After the first war headlines on 2 March, gold had a straightforward reason to rally. World Gold Council reporting from that week described a classic crisis-hedge response: higher oil, heightened geopolitical risk and a sharp early rise in gold. [1]
But the rally also changed the macro backdrop. More expensive energy raised the risk that inflation would stay sticky just as the market was still adjusting to the Fed’s December 2025 cut to 3.50–3.75%. [2] From that point, gold was no longer trading on geopolitics alone.
Start with the bigger structure. March 18 broke a trend that had survived the first war shock.
XAUUSD / DAY · D1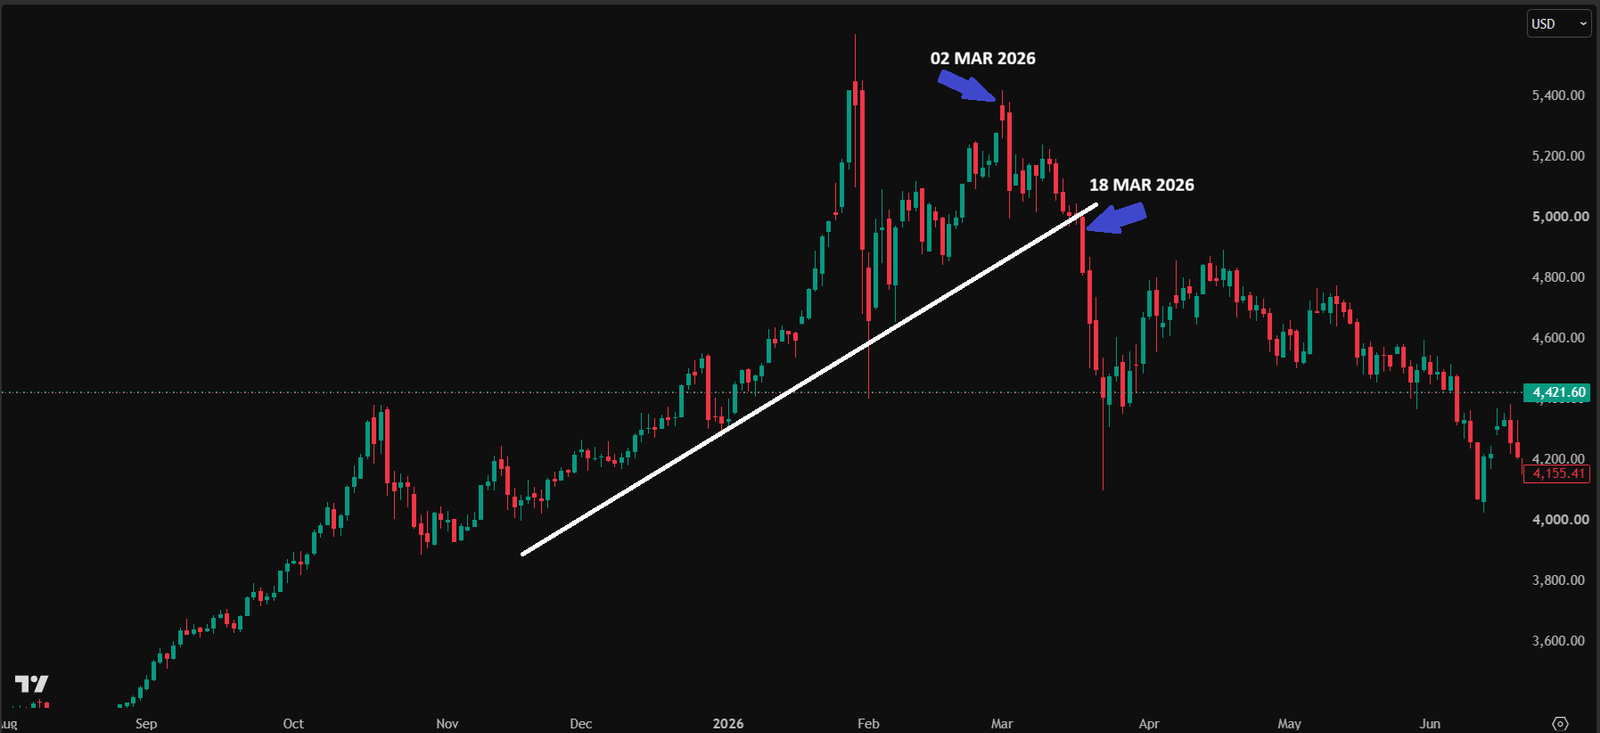
Daily chart supplied by POLARIS. The white trendline highlights the advance that remained intact into mid-March. The 18 March label marks the FOMC session that began to unwind that structure.
Open original chartOn a small screen, swipe across the chart. Open the original for full detail.
Original chart pixels preserved. The annotations inside the images were supplied by POLARIS; only page framing, captions and accessibility text are added by the theme.
Two weeks of hesitation were the market thinking out loud
The H4 chart captures the next phase. For roughly two weeks, gold stopped behaving like a clean one-way safe-haven trade. The blue range is best read as a market trapped between two competing stories.
One story still favored gold: war, uncertainty and the instinct to own protection. The other story worked against it: higher oil, firmer inflation pressure and the risk that the Federal Reserve would have to sound less comfortable about easing. Consolidation was not random. It was hesitation.
What the market was really waiting for
By mid-March, the main question was not whether the war mattered. It was how much that war might feed into policy. If the inflation impulse from energy proved serious, the opportunity cost of holding gold could rise through a stronger dollar, firmer Treasury yields and less confidence in near-term rate cuts.
That is why the daily chart and the H4 close-up belong together. The daily view shows a trend still alive after the initial shock. The H4 view shows that the market was waiting for an external event to decide whether that trend could survive.
From uncertainty to resolution: two weeks of hesitation before the FOMC.
XAUUSD / 4 HOUR · H4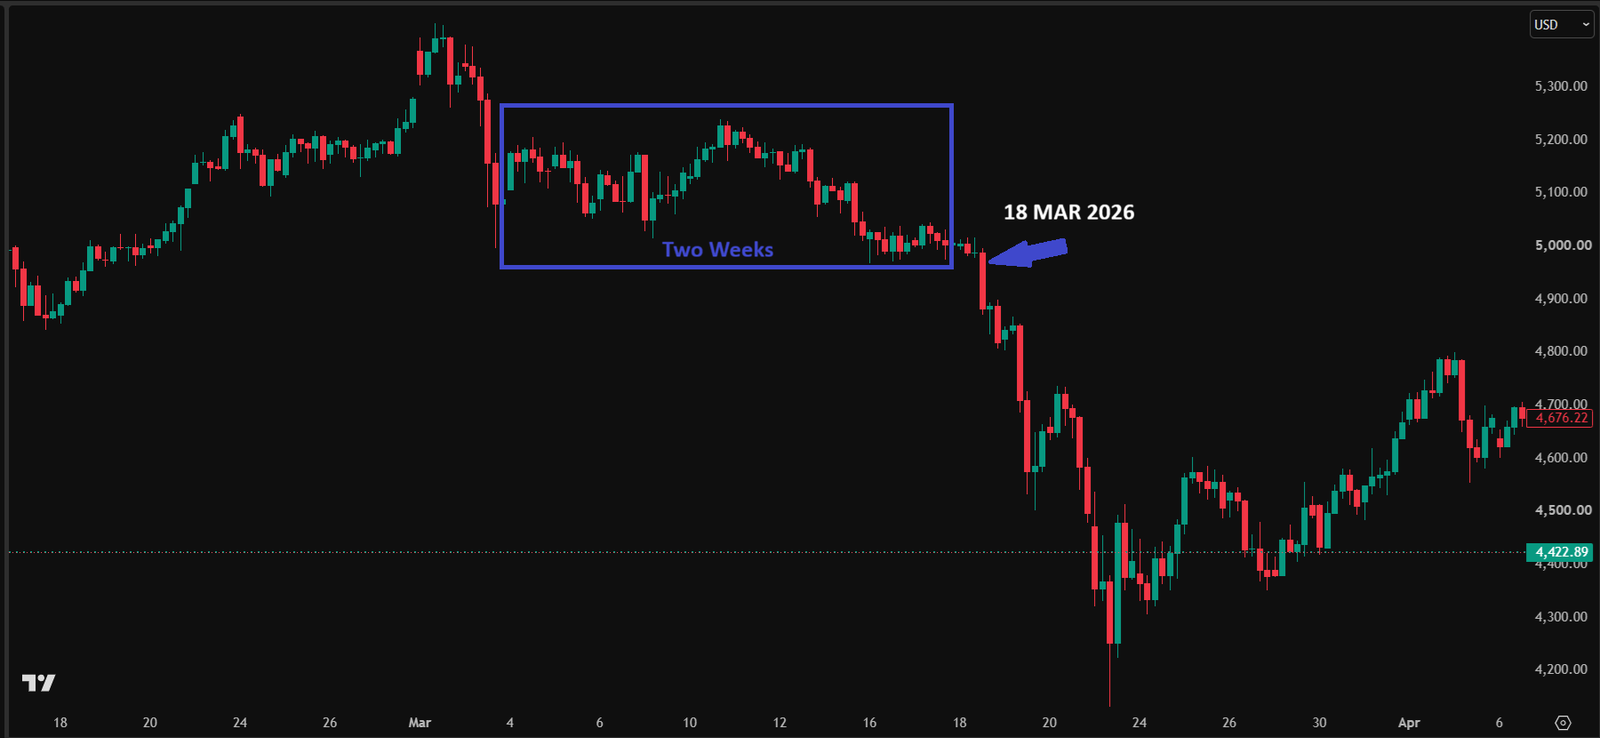
The four-hour chart shows the consolidation that followed the initial war shock. The blue box marks roughly two weeks of hesitation before the 18 March break lower.
Open original chartOn a small screen, swipe across the chart. Open the original for full detail.
Original chart pixels preserved. The annotations inside the images were supplied by POLARIS; only page framing, captions and accessibility text are added by the theme.
March 18: no hike, but a reset in expectations
On 18 March 2026, the FOMC left the target range unchanged at 3.50–3.75%, noted that inflation remained somewhat elevated, and said the implications of developments in the Middle East for the U.S. economy were uncertain. [3]
That was enough. The statement did not deliver an immediate rate increase, but it also did not validate a comfortable easing path. In market terms, the meeting shifted attention from “the Fed might stay easy” toward “the Fed may need to stay tighter for longer.” This article uses that phrase as interpretation, not as a verbatim Fed formula.
In other words, March 18 mattered less because of what the Fed did that day, and more because of what the market started to expect next.
Why gold kept falling after the candle
Gold is highly sensitive to expectations, not just current settings. Once the market repriced the likely path of policy, the metal had to compete with higher yields, a firmer dollar and a less friendly rate narrative. The white trendline on the daily chart helps show why that session mattered: it marked the beginning of a broader structural unwind, not just one isolated red candle.
Later review from the World Gold Council supports that broader reading. Its March commentary attributed much of the month’s weakness to momentum and positioning, with the U.S. dollar and yields also contributing. [4] That does not reduce the role of the FOMC; it places the candle inside a larger repricing process.
The lesson behind the candle
This is why headlines and market direction often part ways. A central bank can hold rates steady and still change the trade by changing expectations. Likewise, a geopolitical shock can support gold first and weaken it later if the policy consequences become more important than the initial fear.
For POLARIS, the value of a chart like this is not in naming a single cause with certainty. It is in identifying the moment when the market stopped paying for one narrative and began pricing another.
Sources & evidence
- World Gold Council — Weekly Markets Monitor: Crisis hedge
- Federal Reserve — FOMC statement
- Federal Reserve — FOMC statement
- World Gold Council — Gold Market Commentary: Anatomy of a fall
Educational retrospective analysis, not a live trading call or a claim that any single factor explains every candle.