4–5 November: election relief reached gold
The US midterm vote took place on 3 November. Democrats won majorities in both chambers of Congress, changing expectations about the constraints on President Donald Trump’s policy agenda. [7] [1]
Reuters’ 4 November market review recorded gold up about 3.5% and oil down about 8%, alongside gains in stocks and bonds. Its analysis pointed to renewed hopes of a deal to end the US–Iran conflict. By 5 November, gold had reached a two-week high as the dollar and Treasury yields eased. [1] [2]
The recovery depended on inflation relief
Our reading is that the political result opened a more favourable scenario for gold: de-escalation could ease energy costs, reduce inflation pressure and give monetary policy more room to normalise. That could soften the yield and dollar headwinds facing bullion.
Rate-hike risk remained substantial. Reuters still reported an 82% market-implied probability of a December increase on 5 November. The recovery was taking place within a market that already expected further tightening. [2]
10 November: the Fed debate became more forceful
Before the CPI release, Governor Christopher Waller publicly raised the possibility of a 50-basis-point December hike if core inflation remained firm. [3]
Separately, Dallas Fed President Lorie Logan argued for at least two additional 25-basis-point increases. Her proposal described cumulative tightening across steps; Waller’s concerned a potentially larger single move. Both added weight to the debate over how much further rates might rise. [4]
4–10 November: relief gives way to renewed selling
XAUUSD / DAILY · D1
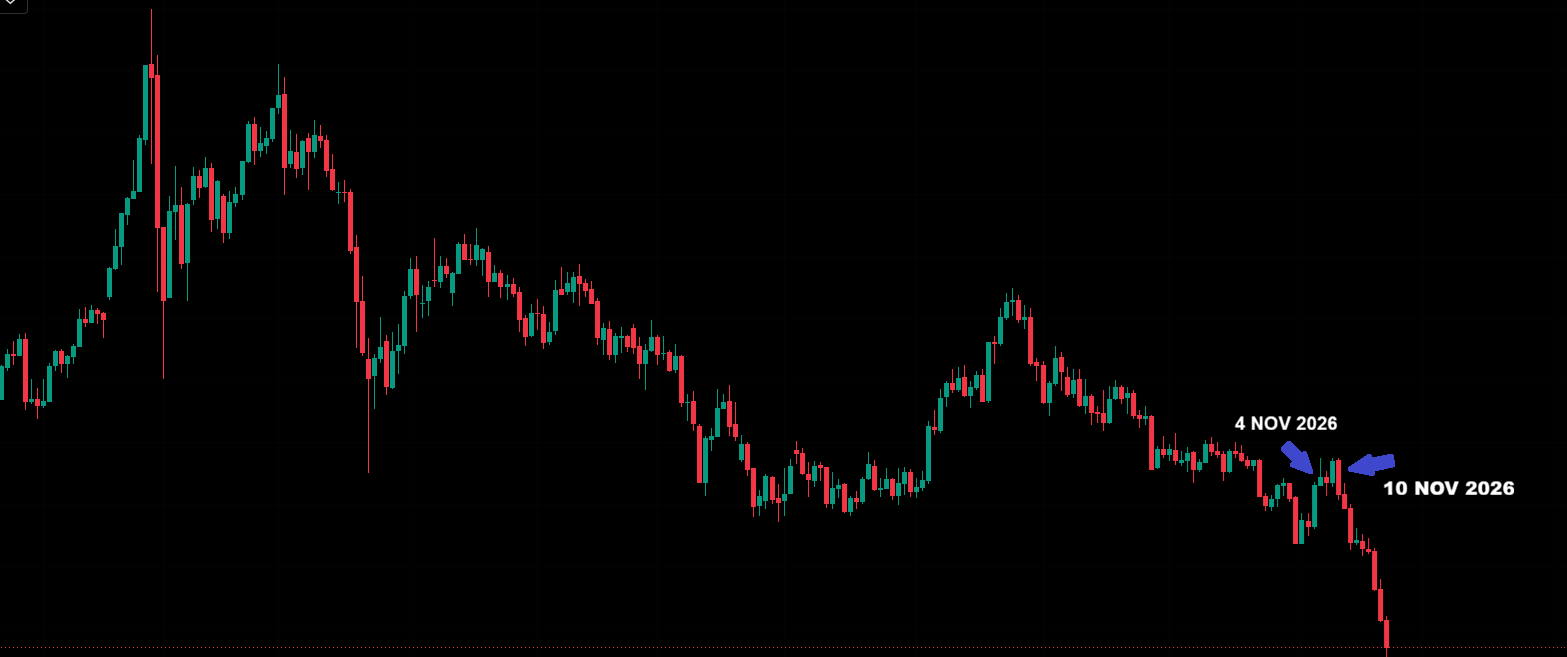
Spot gold · Daily timeframe. The original annotations mark 4 November and 10 November 2026, framing a brief recovery and the return of selling pressure.
Swipe horizontally to inspect the full chart.
The CPI report reinforced the warning
The October CPI report, released on 10 November, showed headline prices rising 0.4% month on month and core prices rising 0.3% for a third consecutive month. Reuters’ poll had expected 0.3% headline inflation and 0.2% core inflation. [5] [6]
Reuters’ same-day market report recorded spot gold down 2.3%, the two-year Treasury yield up roughly 19 basis points and a stronger dollar. Oil was still falling. These were observations during that day’s trading. [6]
That combination is central to our interpretation. Cheaper oil offered relief, but persistent core inflation increased the risk of a tougher Fed response. A higher expected return on dollar assets raised the hurdle for a sustained recovery in gold.
What the two markers show on the XAUUSD daily chart
The supplied chart places the early-November recovery inside a broader decline. The first marker identifies 4 November; around the second, dated 10 November, the recovery gives way to renewed selling. The later price sequence shows further weakness.
Our interpretation is that the rebound failed as inflation and rate expectations regained influence. Daily candles provide context for this sequence; the contemporary reports establish the immediate market reaction. The full later decline also reflects developments beyond these two dates.
More from Behind the candle
Sources & evidence
- Reuters — Trading Day: Oil tanks, stocks leap on US midterms
- Reuters — Gold hits a two-week high as dollar, Treasury yields ease after US midterm elections
- Federal Reserve — Christopher Waller, The Economic Outlook and Some Thoughts on Labor Market Dynamism
- Federal Reserve Bank of Dallas — Lorie Logan, Economic and monetary policy outlook
- BLS — Consumer Price Index, October 2026
- Reuters — US yields rise, stocks fall as inflation data boosts odds of larger December rate hike
- Federal Election Commission — Election and voting information
Retrospective market analysis for educational purposes. Chart supplied by POLARIS.