Aegis
Aegis brings together two strategy sleeves. It lets us examine concentration within a smaller combination; fewer components do not establish that a…
Explore →Session-based range system
A session-based Expert Advisor built around recurring intraday range behaviour in London and New York, with dynamic seasonal adjustment and logic that stays independent from traditional indicator stacks.
Scroll the diagram horizontally or open it at full size.
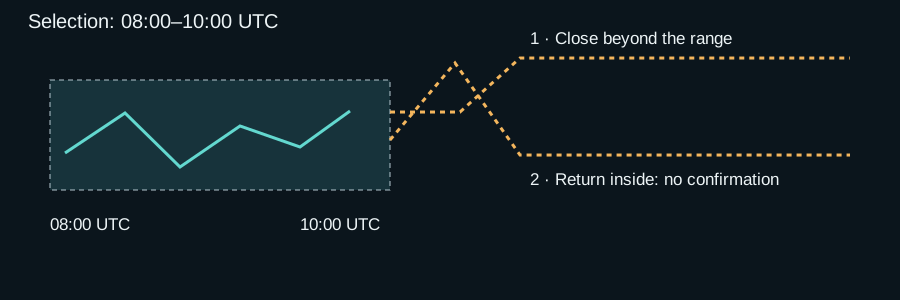
Core idea
In forex and index trading, each part of the day has its own character. Liquidity, volatility, and the way price reacts around key levels can look very different from one session to another.
This Expert Advisor is built around that simple idea. Instead of treating the day as one uniform block, it maps how price tends to behave inside the London and New York sessions and uses those session-specific ranges as part of its trading logic.
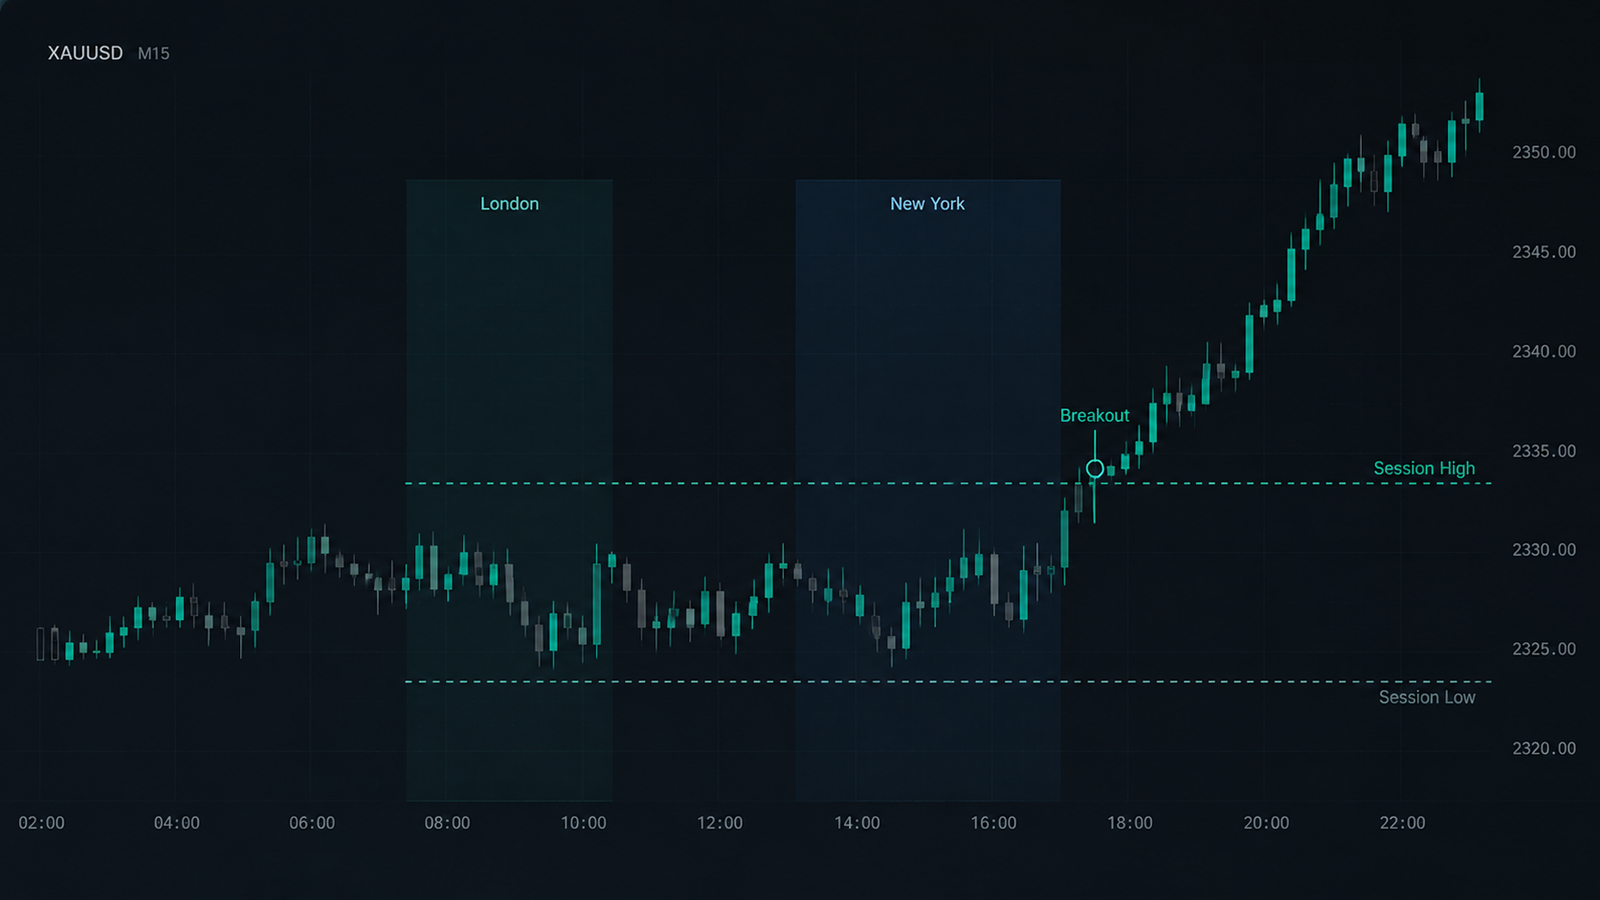
Research base
The model was shaped through long-form statistical work on real market data, with a special focus on Nasdaq and gold. Across more than ten years of observation, we found repeating session behaviours that appear often enough to be useful when handled with discipline.
The system also accounts for the fact that markets do not move exactly the same way in every part of the year. Session behaviour changes with the broader environment, so the internal range logic is adjusted dynamically with seasonal context rather than being frozen into one static template.
Why it matters
Another useful feature of this EA is that its decision process is not built around adding one more conventional indicator to the chart. Its main reference comes from session timing, range structure, and the statistical behaviour we observed in those windows.
That makes it interesting inside a broader portfolio too. Because the logic comes from a different angle, it can work as a parallel or non-overlapping component alongside other systems instead of simply repeating the same type of signal in a new wrapper.
Portfolio role
This system is not meant to explain the entire market on its own. Its job is narrower: read session structure, look for recurring intraday range behaviour, and participate only when that context matches its model.
Inside a portfolio, that gives POLARIS another distinct source of decision-making—especially useful when combining trend, structure, mean-reversion, and specialist systems that rely on very different market assumptions.
System evidence
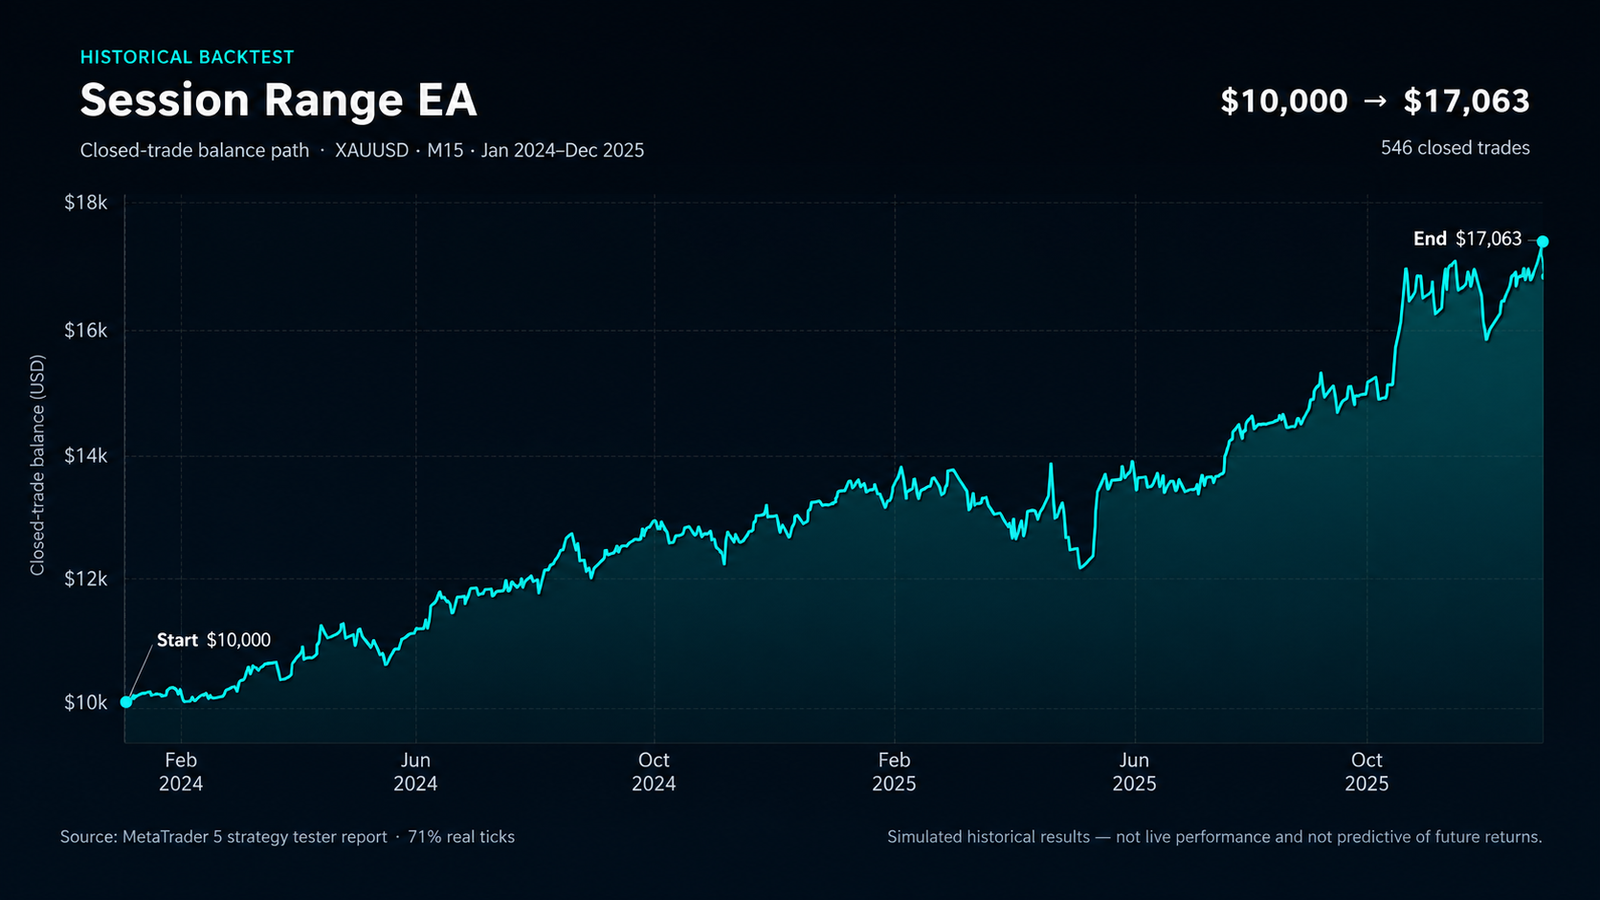
The first chart was rebuilt from the closed-deal history in the supplied MT5 strategy tester report. The second image is the original MT5 record from a separate six-month live-market forward test, using a window that was not part of development or calibration.
Historical test
Six-month live forward test
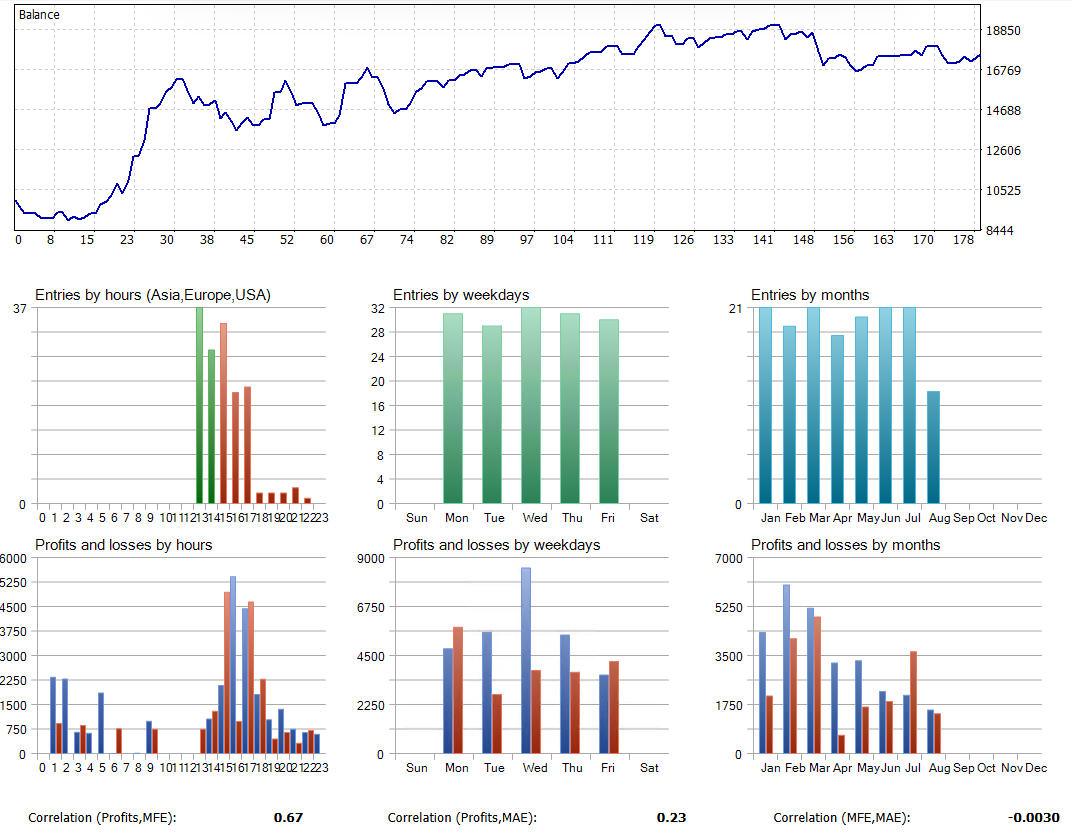
The historical simulation and the live-market forward record are shown separately. The forward-test window was kept outside the development and calibration process so it could act as an untouched evaluation period.
Quick answers
The research focused especially on Nasdaq and gold, using more than ten years of real market data to study repeating session behaviour.
The current public profile highlights London and New York, because those sessions showed the clearest and most useful repeating behaviours for this model.
Because it reduces overlap with systems that depend on common indicator stacks and makes this EA easier to use as a parallel portfolio component.
No. The long balance curve is a historical simulation, while the original MT5 image is a separate six-month live-market forward test on a window that was kept outside development and calibration.
Enquiries
Questions about the design or the software specification are welcome. No account-management or portfolio-access offer is made here.
Ask about the research →