From our research notebook

How a 34% Win Rate Can Still Be Profitable

We revisit a published backtest to explain how the size of winners and losers can matter more than the win-rate headline.

A win rate near 34% can make a result easy to dismiss. We used the published MT5 report to work through the arithmetic: how could a sample with more losing trades than winning ones still finish with positive profit?

We looked at amounts as well as counts

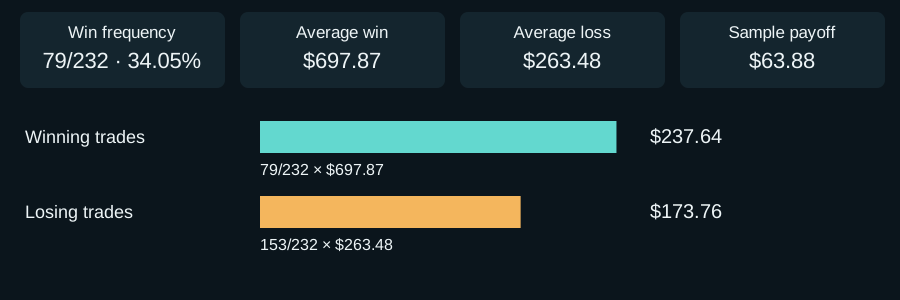
The report shows 79 winning trades out of 232, leaving 153 losers. The rounded average winner was $697.87 and the average loser $263.48. Multiplying each average by its count and spreading the difference across 232 trades gives about $63.88 per trade. The detailed table below lets you follow the calculation.

We examined what the average could hide

That sample also includes 11 consecutive losses and 21.56% maximal balance drawdown. Those figures matter to the experience of holding the strategy. A lower future win rate, smaller winners or higher costs would change the arithmetic; the average does not tell us how losses and large winners were distributed through time.

We kept the unanswered questions visible

The published net profit is $14,819.61 on a $10,000 initial deposit, which would mean $24,819.61 ending balance without other cash flows. We do not infer missing trade-level evidence from those totals. The material also leaves a date-range inconsistency unresolved, so we retain that limitation alongside the calculation.

Explore the technical detailOpen the full method, worked examples and implementation questions. We have kept this material here so you can follow the reasoning as far as you need.

A low win rate does not prevent a trading system from being profitable. It only says that winning trades occur less often. Profitability depends on what those wins are worth relative to the losses.

This documented MetaTrader 5 backtest makes that distinction visible. From January to August 2026, the example robot closed 232 trades. Only 79 were profitable: a win rate of 34.05%. Yet a USD 10,000 initial deposit finished with USD 14,819.61 in net profit, or +148.20%.

This result is not evidence that the robot is robust, safe or likely to repeat the same return. It demonstrates one narrower mathematical point: a system can lose more often than it wins and still have positive expectancy.
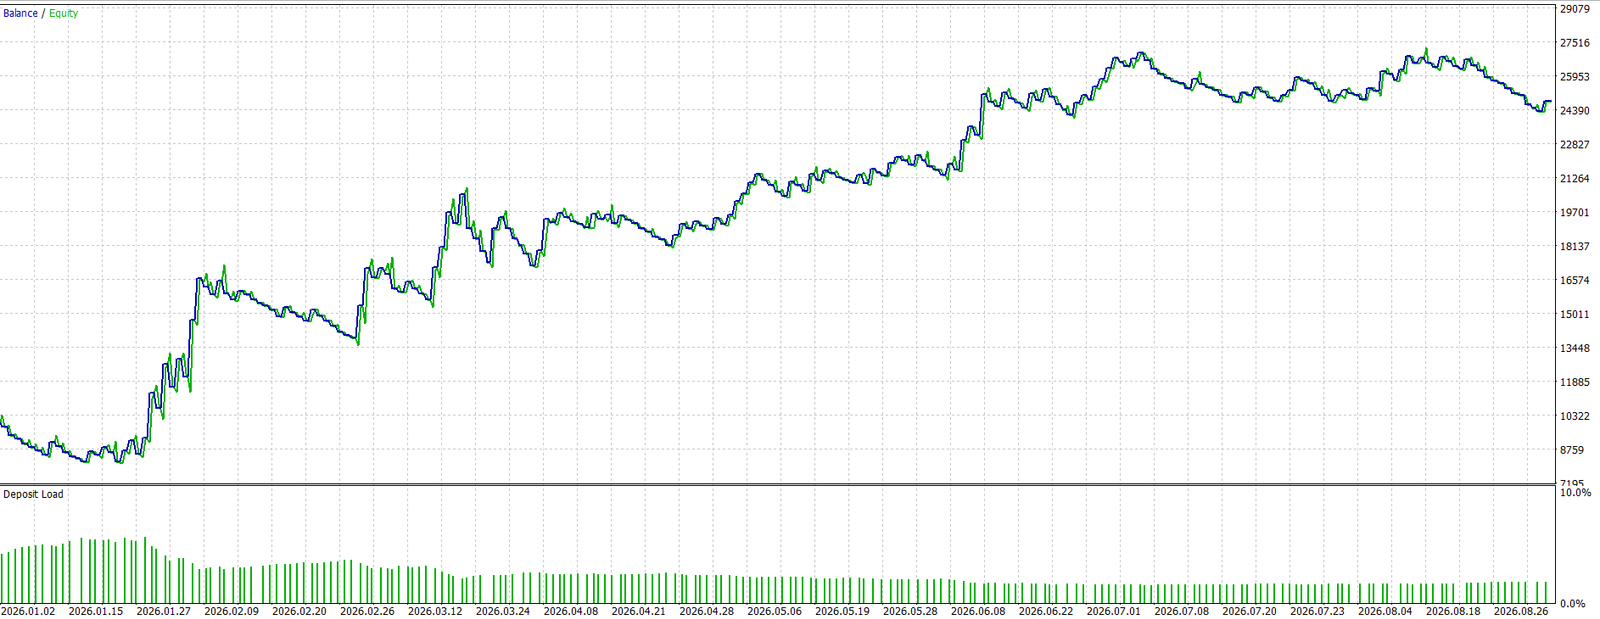
MetaTrader 5 balance and equity curve for the January to August 2026 educational backtest
Figure 1. Original balance and equity curve, January–August 2026. The image is shown as source evidence, not as a performance promise.

Win rate measures frequency, not profitability

Win rate answers one question: how often did a trade finish in profit? It does not say how large the average winner was, how expensive the average loser was, or how severe the path between the two became.

A more useful first calculation is expectancy per trade:

E = (p × W) − ((1 − p) × L)

p = win rate · W = average winning trade · L = absolute average losing trade

For this report:

  • p = 0.3405
  • W = USD 697.87
  • L = USD 263.48

E = (0.3405 × 697.87) − (0.6595 × 263.48) = 237.62 − 173.77 ≈ USD 63.86 per trade.

The report shows an expected payoff of USD 63.88; the small difference comes from using rounded values displayed in the screenshot. The same idea can be written as a profitability condition:

p × W > (1 − p) × L

(p × W) ÷ ((1 − p) × L) = 1.37

Here, the average winner was about 2.65 times the average loser. The break-even win rate implied by those average trade sizes was only about 27.41%:

Break-even win rate = L ÷ (W + L) = 263.48 ÷ (697.87 + 263.48) ≈ 27.41%

The observed 34.05% win rate was above that threshold. That—not the win rate in isolation—is why the sample could finish profitable.
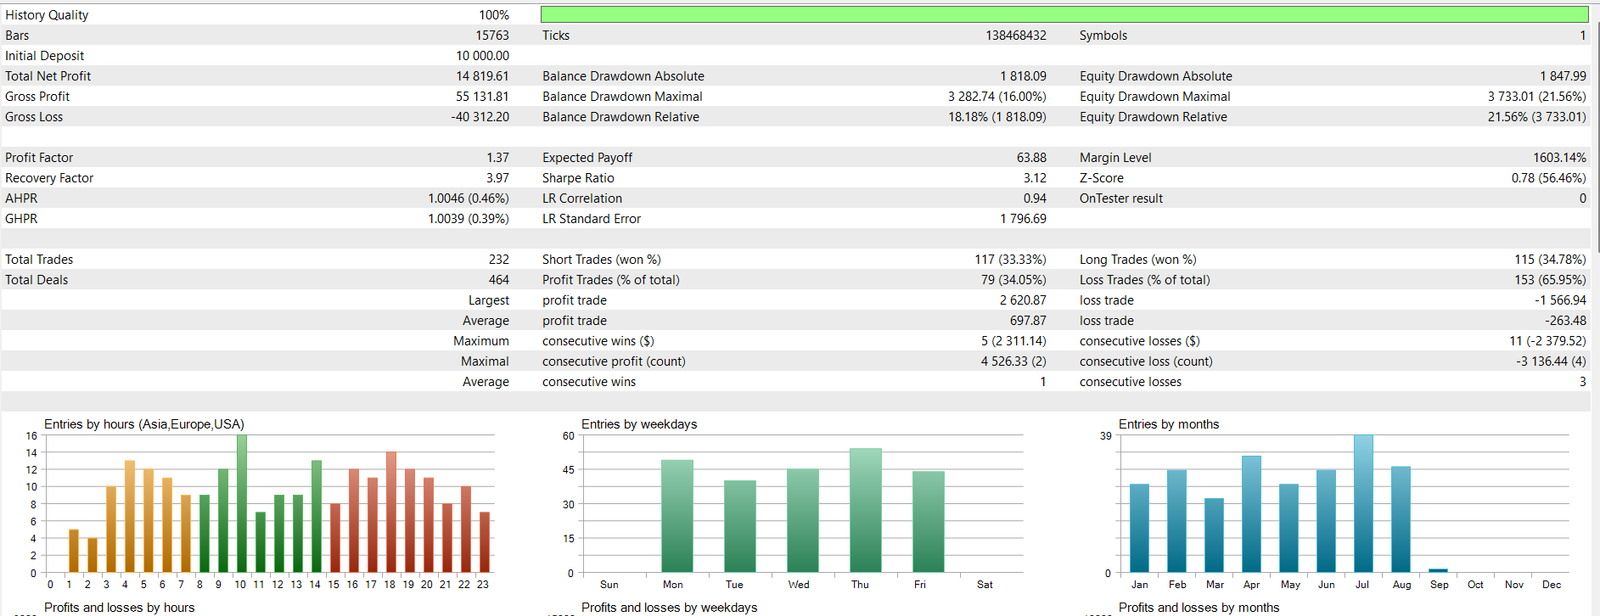
Original MetaTrader 5 backtest statistics showing 34.05 percent profitable trades, average profit trade 697.87 dollars, average loss trade 263.48 dollars and expected payoff 63.88 dollars
Figure 2. Original MT5 testing report. Relevant rows show 232 trades, 34.05% profitable trades, USD 697.87 average profit trade, USD 263.48 average loss trade, USD 63.88 expected payoff and a 1.37 profit factor.

Profitable does not mean comfortable—or safe

The same report records a maximum equity drawdown of 21.56% and a run of 11 consecutive losses. A low-win-rate system can therefore be mathematically profitable while still being psychologically difficult and exposed to meaningful sequence risk.

Expectancy is a better starting point than win rate, but it is not a complete validation. Costs, slippage, sample size, parameter stability, out-of-sample tests, forward performance and drawdown must still be examined. MetaQuotes defines expected payoff as the statistically calculated average return of one trade and separately reports profit factor, drawdown, winning trades and losing trades in the Strategy Tester report.

Conclusion: You do not need to win most trades to grow an account. You need the probability-weighted value of the average winner to exceed the probability-weighted cost of the average loser—and you need a risk structure capable of surviving the losing sequences.

Primary platform reference: MetaTrader 5 Help — Testing Report.
Rebuild the arithmetic, then test how fragile it is

Scroll the diagram horizontally or open it at full size.

Rebuild the arithmetic, then test how fragile it is

The published report shows 79 winning trades out of 232, or 34.05%, and therefore 153 losing trades. Its rounded average winning and losing trades are $697.87 and $263.48. These are realized sample averages, not the strategy’s unknown future expectation or a predesigned reward-to-risk ratio.

The arithmetic explains how a low win rate can coexist with positive sample profit. It does not predict future profitability or establish the report’s reproducibility beyond the published evidence.

Open full diagram ↗

Rebuild the arithmetic, then test how fragile it is

The published report shows 79 winning trades out of 232, or 34.05%, and therefore 153 losing trades. Its rounded average winning and losing trades are $697.87 and $263.48. These are realized sample averages, not the strategy’s unknown future expectation or a predesigned reward-to-risk ratio.

Reconciliation of the published figures
Quantity Calculation Result Interpretation
Sample win rate 79 ÷ 232 34.0517% Matches 34.05% after rounding
Win/loss size ratio 697.87 ÷ 263.48 2.6487 Realized average ratio
Sample payoff (79×697.87 − 153×263.48) ÷ 232 $63.8763 Matches $63.88 after rounding
Net profit Reported $14,819.61 Profit, not ending balance
Ending balance $10,000 + $14,819.61 $24,819.61 Assumes no other cash flow

Sensitivity, holding all else fixed: at a 34.05% win rate and 2.6487 win/loss ratio, expectancy is about 0.242 loss units per trade before any unreported added cost. At 30% it falls to about 0.095; at 27.4% it is near zero. An added cost of 0.10 average-loss units reduces those values by 0.10. This mechanical table does not model changes in trade selection, size or dependence.

The visible report identifies 232 trades, an $10,000 initial deposit, $14,819.61 net profit, 11 consecutive losses and 21.56% maximal balance drawdown. The full settings, exact test header, trade list, sizing rule and cost breakdown are not available in the audited page material. The text says January–August while the monthly image appears to include a small September column; this must remain unresolved until the original report clarifies the period. Without the trade list, uncertainty intervals and ‘remove the largest winners’ analysis should not be invented.

What to verify

  • Preserve the source report and publish its exact date range, symbol/settings, sizing and included costs before extending performance claims.
  • Use the actual trade list for uncertainty, dependence and large-winner sensitivity; aggregated averages are insufficient.
  • Keep sample payoff, future expectation and designed reward/risk as three different concepts.

Limits of this example

The arithmetic explains how a low win rate can coexist with positive sample profit. It does not predict future profitability or establish the report’s reproducibility beyond the published evidence.

Editorial ownership and primary references

Reviewed by POLARIS Research

Evidence scope

This is an educational design and validation analysis. It explains testable failure modes; it is not evidence that a strategy will be profitable.

Primary references

These references support platform behaviour or research concepts. They do not validate POLARIS performance and do not guarantee future results.

Explore the next relevant layer

Move between focused research, system engineering and portfolio construction without losing the context of this page.

Contact POLARIS on WhatsApp