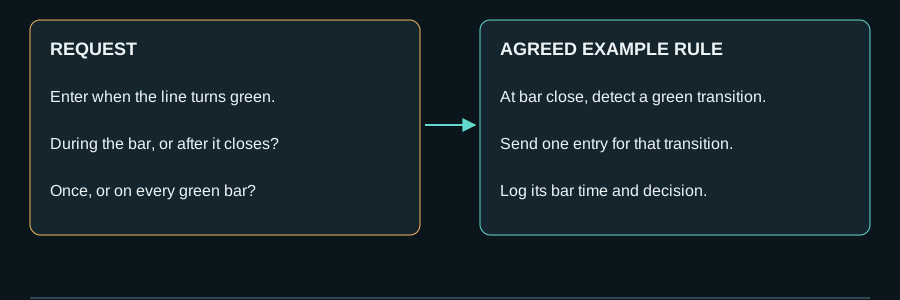
A trading idea can feel perfectly clear when you are looking at a chart. You know the setup you want, the moment you would enter and the kind of trade you would avoid. Then you try to explain it to a developer, and a few small questions change the conversation: which candle counts, can the system enter again, and what happens if another strategy is already using the account?
Those questions are where much of the real work begins. At POLARIS, we see trading-system development as a way to make your idea clear enough to build, test and use with confidence. The code matters. So does making sure it follows the idea you actually had in mind.
Our published archive brings together 170 records: 169 development records and one internal research record. It includes new systems, changes to existing tools, integrations and repairs. That range provides the background for the lessons below. The three examples are made for this article; they explain the reasoning without exposing client projects.
1. A small question can change every trade
Imagine asking for a system that buys when an indicator turns positive. It sounds like a complete instruction. But does it mean “buy once when the value crosses above zero” or “buy whenever the value is above zero”?
The difference becomes obvious when we follow five readings. Assume no other rule blocks an entry. Each row is a new check of the indicator; the first reading follows a value of −0.2.
| Reading | Indicator value | Buy whenever positive | Buy only on a crossing |
|---|---|---|---|
| 1 | 0.3 | Buy request | Buy request |
| 2 | 0.4 | Buy request | No new buy |
| 3 | 0.1 | Buy request | No new buy |
| 4 | −0.1 | No new buy | No new buy |
| 5 | 0.2 | Buy request | Buy request |
The first interpretation produces four buy requests. The second produces two new signals. Neither interpretation is automatically right: repeated entries may be exactly what you want. The problem is leaving that choice to whoever writes the code.
Now imagine that the first trade closes while the indicator is still positive. Should the system enter again? A “one trade at a time” setting does not answer that question. It can hide the ambiguity until the first exit occurs.
What we would agree before building: for this example, check completed candles and create a signal only when the previous value is zero or below and the new value is above zero. Give that signal a unique reference so the same candle cannot trigger a second order after a restart. If permission to trade is denied, let that signal expire at the next candle. Missing indicator data means no entry.
How to check it: replay the five readings and expect two signal references. Repeat the first reading, then restart the system: neither action should create another order for the same signal. These are expected results under our example rules, not reported results from a client test. A system designed to trade within a candle would need a different, equally clear set of rules.
2. Two sensible trades can still be too much for one account
Risk settings can look reassuring when you examine each strategy separately. The harder question is what happens when several strategies want to trade together.
Take a $10,000 account. For this illustration, each trade may risk up to $100 at its stop, while the combined planned loss across the account must stay within $150. Two systems each ask to open a trade with $90 of planned risk. Both pass their own limit. Together, they need $180.
The timing matters. If both systems check the account before either trade appears, each may believe the full $150 is still available. The percentage calculation can be correct while the account-level decision is wrong.
A shared risk check solves this example by setting aside $90 for the first accepted request immediately. Only $60 remains, so the second $90 request is declined. Here we keep trade size fixed; reducing the second trade would be a separate rule to agree.
That reserved amount cannot simply disappear because a reply is slow. If the broker confirms a rejection, it can be released. If the result is unknown, the system must check the actual orders and positions before treating the money as available again. MetaQuotes explains why one trade request can produce several separate updates.
How to check it: send the two requests together, delay one reply and repeat the test after a restart. The planned risk already used or reserved should never exceed $150. This is a design limit, not a promise that losses stop at that amount: gaps, slippage and failed exits can lead to a larger loss.
3. A chart can look clearer afterwards than it did at the time
Suppose a five-minute signal appears at 10:05 and you want the hourly trend to confirm it. Which hourly candle should the system read?
At 10:05, the five-minute candle from 10:00 to 10:05 has closed. The hourly candle from 10:00 to 11:00 still has 55 minutes left. Its final value is not yet known. If the rule uses completed candles, the available hourly candle is the one from 09:00 to 10:00.
Looking back at the finished chart makes it easy to forget that difference. A comparison that uses the final 11:00 value for a 10:05 decision gives the system information it could not have had. Using the live, changing hourly candle is a possible design too, but it is a different rule and must be tested that way.
What we would agree: which candle each input comes from, when it becomes usable and what happens if the data arrives late. For this example, missing history means waiting or skipping according to the agreed rule, never quietly substituting an unfinished candle.
How to check it: the 10:05 decision record should name the hourly candle ending at 10:00 and the five-minute candle ending at 10:05. Delay either input and confirm that the system waits or skips as specified. These times assume continuous data in one stated server timezone; around market closures, the actual candle timestamps must be checked.
4. A correct build and a useful strategy need different checks
The examples so far ask whether the software does what was agreed. A system can pass every one of those checks and still lose money. That is why a good delivery conversation also asks how the trading idea itself will be evaluated.
A backtest shows how the rules behaved on past prices under the chosen test conditions. It is useful, but the result also depends on costs, data quality and how trades are simulated. If a small change in spread removes the apparent advantage, that is something to discover before relying on the system.
One practical approach is to develop the idea on one period, then test it on a separate period that was kept out of those decisions. Follow that with forward observation under stated conditions. If the separate period is repeatedly used to adjust the strategy, it is no longer a fresh check. Each stage adds information; none guarantees the next.
The developer and client should agree what a pass means for each kind of test. “The system opened exactly the intended two trades” is a software result. “The strategy remained useful after costs on unseen data” needs trading evidence of its own.
5. You should be able to understand what your system is doing
A system has to be usable after the first successful test. When it stays out of the market, you should be able to see whether there was no signal, the risk limit was reached or the price data was missing.
A message such as “trade failed” leaves too much unexplained. A record saying “entry skipped: $60 available, $90 required” tells you what happened and where to look. The software version, decision time and broker reply help distinguish a changed rule from a changed trading environment.
Restart behaviour deserves the same attention. Will the system recognise an existing position? Could it repeat an order it already sent? A useful handover includes clear settings, a short operating guide and checks for these situations. These are delivery practices we recommend; the archive does not prove that every historical entry included them.
What this means for your project
The value of experience is knowing which questions to bring forward, while the answers are still easy to change. A new strategy, an indicator conversion and a repair do not need identical plans. They do need a shared understanding of what the finished system should do.
For an initial discussion with POLARIS, three things are especially useful: an example of a trade you want, an example you want to avoid, and the limits the system must respect. You do not need to arrive with a technical specification. Those examples give us a concrete starting point for building one together.
- Before development: agree the signals, timing, position limits and behaviour when information is missing.
- Before acceptance: run a normal case, a borderline case and a failure case, with the expected result written down.
- Before relying on it: review the trading evidence, operating instructions and recovery behaviour.
Our aim is for you to recognise your own trading idea in the finished system and understand how its behaviour was checked. That is the kind of confidence careful development can earn.
Discuss your trading idea with POLARIS · Explore our development capabilities
A closer look at the archive
The archive helps show the range of work behind this discussion. It does not measure profitability or tell us how often a particular error occurred. The details below let you check the numbers without interrupting the practical lessons.
What the 170 records include, and how to read the figures
The figures come from the published archive dataset. One row is one recorded item of work, not necessarily one unique client or trading strategy.
| Type of work | Records |
|---|---|
| New development | 117 |
| Modification and enhancement | 34 |
| Conversion and integration | 12 |
| Debugging and repair | 6 |
| Internal research | 1 |
The 169 development rows have dates from November 2020 to February 2024. The internal research row has no published date or duration. This is a snapshot of the archive, not a current total of everything POLARIS has done. It contains no client sign-off reports, account returns or common acceptance checklist.
Platforms: the labels total 81 MT5, 71 MT4 and 18 MT4/MT5 records. Of these, 108 are explicitly marked as inferred: 52 MT5 and 56 MT4. The other 62 comprise 29 MT5, 15 MT4 and 18 combined labels; “not marked inferred” still does not mean independently verified. Inferred MT4 dates run from November 2020 to December 2021, and inferred MT5 dates from January 2022 to January 2024. They should not be presented as confirmed platform experience.
Categories: each row has one main subject and can have several feature labels. For example, row 1 has risk and trade management as its main subject, plus position-sizing and stop-management labels. It remains one record. An absent label means “not recorded here”, not necessarily “not built”. Unknown dates and durations stay unknown.
The exact feature counts include 45 position-sizing records, 7 multi-timeframe records and 6 indicator-integration records. There are also 6 rows specifically classified as repair work. These figures describe the archive; they are not counts of defects or proof that the example safeguards were delivered in every case.
Some older pages use broader topic groupings. The table keeps those published summaries separate from counts that can be reproduced directly from the rows.
| Topic | Older hub total | Article selection | Count from the data |
|---|---|---|---|
| Indicator integration | 11 | 10 | 6 — feature label |
| Grid and hedging | 38 | 33 | 33 — main subject |
| Price action and structure | 26 | 22 | 22 — main subject |
| Data, statistics and ML | 9 | 3 | 3 — main subject |
| Dashboards and scanners | 22 | 14 | 11 — feature label |
The lists linking the older topic groups and article selections to individual rows are not public, so the differences cannot be fully reconciled. To reproduce the row counts, count each main-subject label once per row, or each occurrence of the named feature once per row. Different features can overlap.
The archive reflects recorded work and client demand, rather than a representative sample of the trading industry. It does not show abandoned work, error frequency or agreement between independent reviewers. Stronger claims would need those records. Future entries would be easier to check if they recorded the accepted version, checklist, decision date, reviewer and evidence location.
| Lesson | Archive count | What explains the lesson | Where the rule can differ |
|---|---|---|---|
| Define the entry event | 6 indicator-integration labels | The first example shows four requests versus two signals; the count does not measure mistakes. | Repeated entries can be intentional. |
| Coordinate account risk | 45 position-sizing labels | The second example shows $180 requested against $150 available; the count does not prove shared risk controls. | Separate, isolated accounts do not share the same capacity. |
| Agree which candle counts | 7 multi-timeframe labels | The third example separates available information from a candle's later final value; this is not an error rate. | Using a developing candle is valid if specified and tested. |
| Make problems understandable | 6 repair records | The logging example explains how a useful message helps investigation; repair rows are not a total defect count. | Repair work can also occur within a new build or modification. |
A few questions you may have
Do 170 records mean 170 profitable client systems?
No. The archive contains 169 development records and one internal research record. It includes several kinds of work and does not establish the number of unique clients or profitable strategies.
Are these examples taken from individual client projects?
No. We created them to make the engineering choices easy to follow. The archive provides context, but the examples are not client case histories or measured client outcomes.
Do I need a technical specification before contacting POLARIS?
No. Start with the trading behaviour you want, an example you would reject and your operating limits. Those details can become the starting point for an agreed specification.
Can I check the archive figures myself?
Yes. The linked dataset lets you count work types, main subjects and exact feature labels. Some broader totals on older pages cannot be reproduced fully because their lists of included records are not public.
Rewritten 6 September 2026. Archive figures refer to the published 170-record snapshot. Client identities, private specifications and code are not disclosed.