From our research notebook

From Scanner and Dashboard to EA

We explain, through a composite case, how we turned the meaning behind scanner rows and colours into events an EA could evaluate.

A dashboard can rely on the person looking at it. The reader may ignore a stale row, notice two opportunities arriving together or decide that an alert has expired. In scanner-to-EA requests, we had to bring those judgments into the specification.

We defined the event behind the display

A highlighted row might describe a continuing condition or the first appearance of a signal. We ask when it becomes valid, which candle it uses and how long it lasts. A screen refresh should not automatically create another trade request.

We separated calculation from presentation

In this composite design, the scanner produces a qualified event with its source time and expiry. The display shows it; the execution side checks it. Ranking simultaneous candidates, waiting for symbol data and applying account limits become explicit parts of the process.

We preserved reasons as well as opportunities

We want to explain why a visible candidate was accepted, delayed, blocked or allowed to expire. Separate symbol properties and restart state belong in that explanation. The case combines archive patterns so we can discuss the method without publishing a private scanner formula.

Explore the technical detailOpen the full method, worked examples and implementation questions. We have kept this material here so you can follow the reasoning as far as you need.

The shared starting point was a dashboard that ranked or highlighted opportunities across several symbols. A human could look at the table, ignore a stale row, interpret a colour change, and decide whether an alert still mattered. The requested EA had to make those judgments explicit.

This case combines multiple archive patterns and describes the engineering hand-off from observation to execution without exposing an original scanner, private formula, or client workflow.

Composite case · CASE-05

From visual row to verified order

Ranking and display are separated from permission and execution.

  1. 01
    DetectCalculate the per-symbol condition from synchronized data and a defined bar state.
  2. 02
    QualifyAttach direction, strength, source time, expiry, and duplicate-event identity.
  3. 03
    PermitApply portfolio exposure, session, spread, position, and cooldown rules.
  4. 04
    ExecuteSend the request, verify the broker result, update state, and retain an audit trail.

Shared problem

The visual tool showed useful information but did not define when a colour first became a signal, whether the current candle was final, how long a row remained valid, or what happened when two symbols changed together. Those omissions were manageable for a human and unsafe for automatic execution.

Constraints

The EA had to work across symbols with different data readiness, sessions, point values, volume steps, stop distances, and spread conditions. It also had to avoid duplicate entries when the dashboard refreshed repeatedly and preserve state across terminal restarts.

Composite solution

The scanner was separated into calculation, event, ranking, and presentation layers. Execution consumed only a qualified event object with a source timestamp and expiry. A portfolio permission layer checked exposure and operating conditions before the order module acted and verified the final result.

Practical outcome

The dashboard remained useful for observation, while the EA used the same underlying states without reading colours or screen objects. Logs could explain why a visible opportunity was accepted, delayed, rejected, or expired.

Questions you may have

Can an EA read signals directly from dashboard objects?

It can, but a shared calculation interface is usually more reliable than treating colours, labels, or chart objects as the primary data contract.

Was this one scanner product?

No. It is a composite of recurring scanner, indicator, dashboard, and execution hand-off patterns.
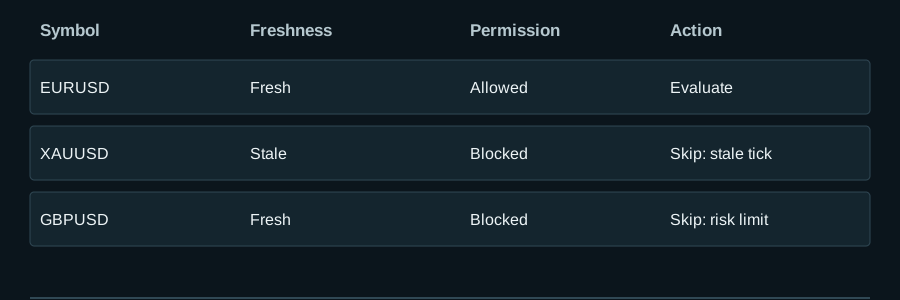
Turn a dashboard row into a controlled order decision

Scroll the diagram horizontally or open it at full size.

Turn a dashboard row into a controlled order decision
Educational design example — values and states are not live performance.

Illustrative states and times; label the clock and threshold in the real example.

Open full diagram ↗

Turn a dashboard row into a controlled order decision

This constructed scanner ranks three symbols at 10:00:05. Every candidate carries source time, expiry, data-ready state and event ID. The account permits one new position. Higher score wins; ties use the earlier source time, then alphabetical symbol as a final deterministic rule.

Synthetic scanner snapshot
Symbol Score Source / expiry Readiness Decision
EURUSD 82 10:00:00 / 10:05:00 Ready Rank 1
GBPUSD 82 09:59:55 / 10:04:55 Ready Rank 2: earlier source wins only if the rule says so; here score tie uses earlier source
XAUUSD 91 09:58:00 / 10:03:00 Stale at decision Excluded, not ranked

Five events follow: snapshot received; XAUUSD rejected as stale; GBPUSD wins the declared tie; risk reserves capacity; request G-82 is sent and later confirmed. The candidate is then consumed. A refresh that repeats G-82 cannot create another request. After restart, the system restores the consumed event and confirms the live position before evaluating new rows.

A useful log reads: ‘10:00:05 XAU excluded—expired 10:03; EUR/GBP tie—policy earlier source selects GBP; capacity 1→0 reserved by G-82; 10:00:07 deal confirmed.’ Ranking, risk permission and execution remain separate decisions.

What to verify

  • Replay a stale row, score tie, one-position limit and duplicate dashboard refresh.
  • Store source time, expiry, event ID, rank reason and consumption state with each candidate.
  • Restart between reservation and confirmation and reconcile before selecting another symbol.

Limits of this example

The scores and outcomes are synthetic. They demonstrate the handoff from observation to execution, not performance of a client scanner.

Editorial ownership and primary references

Reviewed by POLARIS Research

Evidence scope

This is a composite case drawn from recurring implementation patterns. It is not a description of one identifiable client engagement.

Primary references

These references support platform behaviour or research concepts. They do not validate POLARIS performance and do not guarantee future results.

Explore the next relevant layer

Move between focused research, system engineering and portfolio construction without losing the context of this page.

Contact POLARIS on WhatsApp