From our research notebook

Renko, Offline Charts and Custom-Timeframe Engineering

Our work with custom charts led us to examine how bars are built, when they become final and how the same history can be reconstructed.

Renko and custom charts let us look at price movement differently. Building around them made us examine the process behind the finished picture: which source observations created each bar and when an EA could legitimately act on it.

We defined how the chart was produced

Brick size, reversal rules, wicks, gaps and rounding can all change the synthetic series. One source tick may create several completed bricks. We need a consistent order for those events because indicators and signals can depend on it.

We kept real time attached to the picture

A Renko brick does not have a fixed duration, but session limits, news windows and daily controls still use time. We preserve the source timestamp and distinguish a forming brick from a completed one. A historical reconstruction must not lend earlier decisions information that arrived later.

We examined the whole chain after a restart

We compare chart generation, indicator inputs and EA decisions using the same source data. Restarting or changing the available history should have an explained effect, rather than silently drawing a different recent past. A synthetic chart also does not supply executable prices by itself; those remain a separate concern.

Explore the technical detailOpen the full method, worked examples and implementation questions. We have kept this material here so you can follow the reasoning as far as you need.

Renko and other custom charts replace the platform’s standard time-bar contract with a synthetic one. That can make market movement easier to study, but it also creates engineering questions that are invisible on a finished chart: when a brick becomes final, how several bricks from one tick are ordered, and what history is available after a restart.

An indicator can tolerate a visual inconsistency that an EA cannot. Automated decisions require the generator, chart, indicator, tester, and execution module to agree on exactly the same synthetic-bar state.

Engineering note · ENG-09

The synthetic-bar contract

The trading rule sits downstream of a reproducible chart generator.

  1. 01
    SourceDefine the tick or lower-timeframe feed, price side, session, and history boundary.
  2. 02
    BuildSpecify brick size, reversals, gaps, multi-brick ticks, timestamps, and volume.
  3. 03
    ConfirmSeparate forming and completed synthetic bars and define whether history can revise.
  4. 04
    ConsumeMake indicators, EAs, restarts, and tests read the same versioned series.

Synthetic bars need exact rules

Fixed and volatility-based brick sizes behave differently. The generator also needs policies for wicks, gaps, reversal distance, price rounding, volume assignment, and several completed bricks created by one source tick. Small differences can move indicator values and signal timing.

Time still matters

Renko removes fixed-duration candles, not chronology. Session filters, daily limits, higher-timeframe context, and economic-news windows still depend on real time. Every brick therefore needs a consistent source timestamp, especially when multiple bricks share one tick or when historical data is rebuilt.

Control revisions and restarts

A forming brick may disappear or change direction. The system must state whether decisions use only completed bricks and how the last confirmed state is restored. Rebuilding from a different history depth must not silently create a different recent chart.

Test the whole chain

It is not enough to test the EA on a chart that already exists. Validation should rebuild the series from raw inputs, compare online and offline generation, restart at difficult points, and verify that identical source data produces identical synthetic bars and decisions.

  • Version the generator with the strategy.
  • Expose forming and confirmed states separately.
  • Preserve source timestamps for every synthetic bar.
  • Define history depth and rebuild rules.
  • Compare live-built and historically rebuilt series.

Questions you may have

Do Renko charts remove market noise?

They reorganize price movement by a chosen brick rule. They can hide the time dimension and do not remove spread, slippage, gaps, or parameter sensitivity.

Can an EA trade directly from an offline chart?

Yes in some architectures, but data updates, chart state, order execution, restarts, and testing must be engineered deliberately for the platform and generator used.
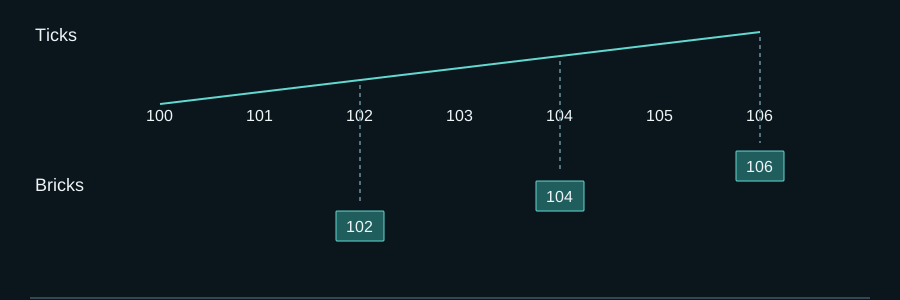
Define the builder before trusting the synthetic chart

Scroll the diagram horizontally or open it at full size.

Define the builder before trusting the synthetic chart
Educational design example — values and states are not live performance.

Example: start 100, brick size 2 units; emit at 102 / 104 / 106.

Rising sequence only. Specify a separate reversal rule before adding falling prices.

Open full diagram ↗

Define the builder before trusting the synthetic chart

This constructed builder uses 10-point bricks, close-only construction and the last confirmed brick close as its anchor. A tick may create several bricks. Completed bricks receive the triggering tick’s timestamp plus a sequence number; the current unfinished brick is never a signal source.

Replay one tick sequence, including reversal and gap
Tick time / price Builder action Confirmed output Sequence
09:00:00 / 100 Initialize anchor None 0
09:00:03 / 112 Rise passes 110 Up brick 100→110 1
09:00:06 / 105 Reversal threshold not met None 1
09:00:08 / 88 Reverse and pass 100, 90 Down 110→100; down 100→90 2, 3
09:00:12 / 125 Gap creates 100, 110, 120 Three up bricks 4, 5, 6

A clean start and a restart after sequence 3 must produce the same final sequence 1–6 when the persisted anchor, direction and last processed tick key are restored. A history rebuilt from different tick granularity may differ; that difference must be identified as source-data variation rather than silently repaired to resemble the live chart.

The synthetic symbol supplies analytical bricks. Orders still execute on the real market symbol and current bid/ask. A brick close of 120 is not necessarily an available fill: after the gap the first executable ask might be 126.5. Signal price, order price and slippage therefore remain separate fields.

What to verify

  • Replay the same ordered ticks from clean start, midstream restart and full rebuild; hash completed brick fields.
  • Test duplicate ticks, multi-brick gaps and a reversal exactly at the threshold.
  • Map synthetic symbol, execution symbol, contract properties and price source explicitly.

Limits of this example

Different Renko conventions can all be valid. Reproducibility applies to the declared version and input data, not every chart called Renko.

Editorial ownership and primary references

Reviewed by POLARIS Research

Evidence scope

This article combines official platform behaviour with recurring, anonymized implementation patterns. Exact trading rules and client material are excluded.

Primary references

These references support platform behaviour or research concepts. They do not validate POLARIS performance and do not guarantee future results.

Explore the next relevant layer

Move between focused research, system engineering and portfolio construction without losing the context of this page.

Contact POLARIS on WhatsApp