From our research notebook

Hidden Ambiguity in Indicator Changes

We show how a familiar instruction—“trade when the indicator changes”—led us to clarify the exact event, timing and reset rule behind a signal.

“Enter when the indicator changes” is the kind of request we can understand immediately when looking at a chart together. Coding it made us slow down. A colour change, a zero crossing and a new arrow can look related while telling the program to act at different moments.

We pin down the moment

We ask whether the change must happen on the open candle or survive until it closes. A signal can appear and disappear during that interval. Higher timeframes need the same decision: an unfinished daily candle does not become final just because a shorter candle has closed.

We identify what the program can actually read

We trace the visible mark back to its buffer, object or numerical state. Then we describe the previous state, the new state and any threshold tolerance. This also gives us a place to distinguish an empty value from a neutral reading and a continuing condition from a fresh event.

We make disagreement something we can examine

We want a record of what the indicator showed when the decision was made. That helps us investigate signals that later move, vanish or appear differently after a restart. With the event written down, we can compare the intended rule with the program's behaviour instead of arguing over a finished chart.

Explore the technical detailOpen the full method, worked examples and implementation questions. We have kept this material here so you can follow the reasoning as far as you need.

“Open a trade when the indicator changes” is a common and perfectly natural request. A human looking at a chart may feel that the meaning is obvious. To an Expert Advisor, however, the sentence is incomplete.

The change might happen inside the current candle, after the candle closes, when a line crosses a level, when one buffer replaces another, when a colour changes, or only after the new state remains valid for several updates. Each interpretation can produce a different trade history.

Signal specification

What must be clear before coding

Before an indicator change can become an EA rule, the data, event, confirmation time, and reset condition must all be defined.

  1. 01
    Data stateCurrent candle or closed candle?
  2. 02
    EventCross, value change, colour, arrow, object, or buffer state?
  3. 03
    ConfirmationImmediate, after close, or after several valid updates?
  4. 04
    ResetOnce, once per bar, or only after an explicit reset condition?

Current or closed bar?

An indicator can change many times while a candle is open. If the EA reacts immediately, it may enter on a state that disappears before close. If it waits, the signal is slower but more stable. Neither choice is automatically correct; the strategy must choose.

The same question applies to higher-timeframe indicators. A daily value read during the day is not the same as the final daily value visible later on the chart.

What counts as a change?

A cross above zero, a move from negative to positive, a colour switch, a new arrow, and a numeric increase are different events. Some indicators expose several buffers, and the visible object may not be the value the EA should read.

The rule should name the exact source, previous state, new state, direction, and any tolerance around the threshold.

Can the signal repaint?

Some indicators recalculate recent history or move a signal after new data arrives. A screenshot can then show an excellent past entry that was not available in that form at the decision time.

Before automation, the indicator should be observed tick by tick and after restart. The EA also needs a rule for missing values, history updates, and duplicate signals.

A useful specification

A short definition prevents long debugging sessions. The following points are usually enough to turn “indicator changed” into a testable event.

  • Indicator name, version, symbol, timeframe, input settings, and exact buffer or object.
  • Current candle or closed candle, including the bar index used for confirmation.
  • Previous state, new state, cross direction, threshold, and numeric tolerance.
  • Whether one signal may trigger once, once per bar, or again after a reset condition.
  • What cancels the setup, blocks a trade, or closes an existing position.
  • Expected behaviour after terminal restart, timeframe change, or incomplete history.

Why this matters

When the rule is precise, disagreements become testable. The trader can compare the intended event with logs and chart marks, and the developer can reproduce the same result. Clarity does not make a strategy profitable, but it makes honest evaluation possible.

Questions you may have

Should every indicator signal wait for a closed candle?

No. Intrabar signals can be valid, but their changing nature and execution rules must be intentional and tested.

Is repainting always a defect?

Not always. Some tools are designed to recalculate. The problem is using a historical appearance as if it had been available in real time.
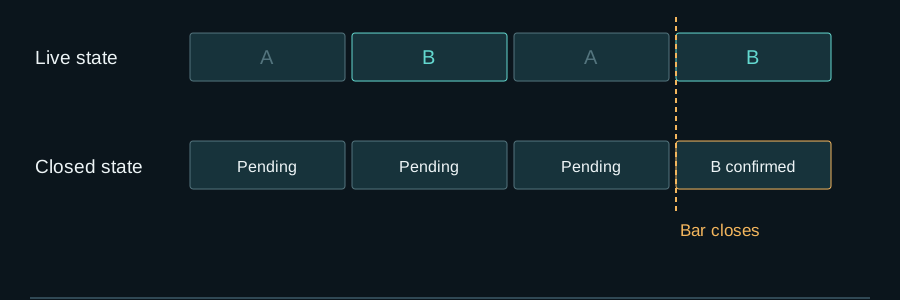
Make one sentence produce one signal history

Scroll the diagram horizontally or open it at full size.

Make one sentence produce one signal history
Educational design example — values and states are not live performance.

Illustrative state sequence: only the final B is confirmed at close.

Open full diagram ↗

Make one sentence produce one signal history

The table uses a constructed indicator around a zero threshold. L means ‘value is positive’, C means ‘a non-positive value crosses to positive’, and S means ‘two completed positive readings confirm the state’. EMPTY breaks continuity and resets the confirmation count.

Eight observations under three reasonable meanings of ‘the indicator changed’
Observation Bar state Previous → current L: positive C: crossing S: stable twice
1 closed −0.10 → 0.00 No No No
2 open 0.00 → 0.04 Yes now Yes now No
3 same bar closes 0.04 → −0.02 No Signal disappears No
4 closed −0.02 → 0.03 Yes Yes No
5 closed 0.03 → 0.05 Yes again No Yes
6 closed 0.05 → EMPTY No data No Reset
7 closed EMPTY → 0.06 Yes No continuity First positive
8 closed 0.06 → 0.07 Yes again No Yes

A copyable rule for C is: on each newly completed source bar, emit BUY only when both values exist, previous ≤ 0 and current > 0; equality belongs to the non-positive side; allow one event per symbol, timeframe and source-bar time; reset only after a completed value ≤ 0. This definition does not silently bridge EMPTY.

To test repainting, store timestamp, bar status, raw buffer value and emitted event on every change. Reload the same history and compare the saved live series with the reconstructed series. Observation 2 is the simulated repaint case: the open-bar cross existed live but vanished by close.

What to verify

  • Test equality at zero, small oscillations within a stated tolerance and consecutive EMPTY values.
  • Repeat the same bar and restart after observation 4; no duplicate event may appear.
  • If raw buffers or object identity cannot be observed reliably, stop before connecting orders.

Limits of this example

This article diagnoses ambiguity. The full signal-to-order contract, permission and recovery states belong to the indicator-to-EA implementation article.

Editorial ownership and primary references

Reviewed by POLARIS Research

Evidence scope

This is an educational design and validation analysis. It explains testable failure modes; it is not evidence that a strategy will be profitable.

Primary references

These references support platform behaviour or research concepts. They do not validate POLARIS performance and do not guarantee future results.

Explore the next relevant layer

Move between focused research, system engineering and portfolio construction without losing the context of this page.

Contact POLARIS on WhatsApp