From our research notebook

Why a Good Backtest Can Still Fail

We explain why a promising backtest leads us to more questions about data, costs and stability, and how those questions shape our research process.

A strong backtest gives us a reason to investigate an idea. In our research, the next question is what made that result possible. Was it the market behaviour we intended to capture, or a convenient combination of data, settings and execution assumptions?

We look behind the curve

We begin with the test's inputs: price history, symbol properties, spread and the information available at each decision. Missing ticks or a signal reconstructed with later information can make a report look better without improving the underlying method. We also keep track of how often we have returned to the same period while changing the rules.

We ask how much room the idea has

We examine nearby parameters and less comfortable costs. If a small change in a threshold, spread or fill timing destroys the result, we need to understand why. A broad region of reasonable behaviour gives us a different basis for discussion from one exceptional parameter setting.

We give each stage a separate job

Historical testing helps us inspect a rule. Untouched data challenges choices made during development. Forward observation helps us see the effects of current prices and execution. We use these stages to build a clearer picture, while recognising that a strategy may still struggle when market conditions change.

Explore the technical detailOpen the full method, worked examples and implementation questions. We have kept this material here so you can follow the reasoning as far as you need.

A good backtest is not useless. It is one of the most important tools in systematic trading. The problem begins when we ask it to prove more than it can prove.

A historical test can show how a precise rule set behaved inside a particular data and execution model. It cannot, by itself, show that the same behaviour will survive unseen data, different spreads, delayed fills, platform details, or a market regime that was under-represented in development.

Evidence chain

How validation moves forward

Each step answers a separate question, from whether the idea makes sense to whether its real behaviour remains within the expected limits.

  1. 01
    Market logicIs there a reason for the rule to exist?
  2. 02
    Historical modelHow did the exact rules behave under stated assumptions?
  3. 03
    Stress checksDo nearby settings, costs, and feeds change the conclusion?
  4. 04
    Unseen dataDoes the result survive data that did not shape development?
  5. 05
    Forward observationDoes timing and execution remain credible as data arrives?
  6. 06
    Live monitoringDoes real behaviour remain inside the defined risk and operating limits?

Data can flatter the result

Missing ticks, synthetic history, incorrect symbol settings, convenient spread assumptions, or accidental look-ahead can all improve a report without improving the strategy. Even clean data can become contaminated when parameter choices are repeatedly adjusted after seeing the same period.

The response is not to avoid optimization. It is to define a sensible parameter area, calibrate with a clear purpose, and reserve untouched data for a decision the development sample cannot influence.

Execution changes the trade

In live trading, the requested price is not always the filled price. Spread expands, liquidity changes, orders can be delayed or rejected, and brokers may differ in contract settings or price feeds. A strategy that depends on very small edges is especially sensitive to these details.

A realistic test therefore needs defensible costs and a clear view of how the platform handles orders, stops, sessions, and missing data.

Parameters can be fragile

One profitable parameter set is less convincing than a stable area where nearby settings behave reasonably. If a small change turns a good curve into a collapse, the test may have found a historical accident rather than a durable relationship.

Sensitivity checks, shifted data, alternative feeds, and stress assumptions help reveal whether the idea has room to breathe.

Markets change

A strategy may be valid and still enter a weak season. Trend, volatility, liquidity, correlation, and participant behaviour change over time. No historical window contains every future combination.

This is why portfolio role and ongoing monitoring matter. A system should be judged against the behaviour it was built to express, not against the expectation that it must profit in every month.

A stronger validation chain

Our preferred sequence is: logical market idea, long historical test, careful calibration, sensitivity and stress checks, untouched out-of-sample data, forward observation, and then live monitoring under defined risk.

Passing every stage still does not guarantee profit. It does make the evidence more honest and exposes weaknesses earlier, when they are cheaper and safer to address.

  • Separate development data from final validation data.
  • Use realistic spread, commissions, slippage, and order constraints.
  • Check nearby parameters and alternative data feeds.
  • Compare historical expectations with forward and live behaviour.
  • Define risk and stop conditions before deployment.

Questions you may have

Does this mean backtests are unreliable?

No. A well-designed backtest is essential evidence. It becomes unreliable when data, assumptions, or interpretation do not match the question being asked.

Is out-of-sample testing enough on its own?

No single stage is enough. Out-of-sample, forward, and live observation test different weaknesses.
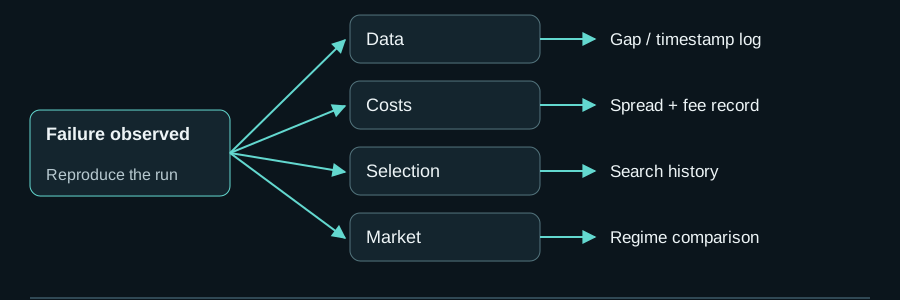
Diagnose the failure before changing the strategy

Scroll the diagram horizontally or open it at full size.

Diagnose the failure before changing the strategy
Educational design example — values and states are not live performance.Open full diagram ↗

Diagnose the failure before changing the strategy

A disappointing forward result can come from the idea, the test or execution. Changing several assumptions at once hides the cause. This constructed example keeps the strategy fixed and changes one input at a time.

Controlled backtest diagnosis — illustrative figures, not POLARIS performance
Run Only change Net result What it can tell us
Baseline $2 spread, stated commission, no added delay +12.0% Reference only
Cost stress Spread becomes $3 +4.1% A large part of the edge depends on trading cost
Delay stress One-bar execution delay −1.8% Entry timing is fragile
Data correction Remove future-filled feature values −3.2% The baseline used information unavailable at decision time

The numbers are deliberately illustrative. In a real study, change one assumption, preserve the same trades where possible and record exactly which orders moved or disappeared. If live signals match but fills differ, investigate execution. If signals differ before orders exist, inspect data and code. If both match and the loss remains within a predeclared range, normal variation is still plausible.

PBO and the Deflated Sharpe Ratio answer different selection questions. PBO estimates how often a selection process picks a configuration that ranks poorly out of sample; it needs a family of tried configurations and suitable sample partitions. DSR adjusts an observed Sharpe for repeated selection and non-normal returns; it needs the search count or equivalent selection information and return moments. Neither supplies a universal pass mark or creates independent observations.

What to verify

  • Before searching, lock the cost stresses, untouched period and decision categories: advance, investigate or reject.
  • Record every tried specification; revisiting the final period turns it into development data and requires a new untouched check.
  • Count effective independent opportunities, not just bars or trades, when positions share time and market exposure.

Limits of this example

A regime explanation is useful only when the regime variable and expected response were defined before inspecting the loss. Otherwise it can explain every outcome after the fact.

Editorial ownership and primary references

Reviewed by POLARIS Research

Evidence scope

This is an educational design and validation analysis. It explains testable failure modes; it is not evidence that a strategy will be profitable.

Primary references

These references support platform behaviour or research concepts. They do not validate POLARIS performance and do not guarantee future results.

Explore the next relevant layer

Move between focused research, system engineering and portfolio construction without losing the context of this page.

Contact POLARIS on WhatsApp