From our research notebook

Why More Filters Do Not Always Help

We explain how we assess an extra filter: what mistake it is meant to prevent, which opportunities it removes and whether it adds new information.

Adding another confirmation can feel like progress. In strategy work, we have had to ask whether it clarifies the idea or simply makes a familiar historical period look cleaner. Different indicator names can still describe much the same market behaviour.

We give a filter a reason to exist

Before adding a condition, we state the mistake it is intended to prevent. A trend filter, for example, should have a role distinct from an entry trigger that already measures momentum. This makes it possible to ask whether the extra condition changes the decision for a useful reason.

We examine what disappears

We compare the base method with the filtered version on the same observations. We look at opportunity count, delayed entries and the trades removed, as well as the final result. A smoother curve built from very few remaining trades may tell us more about selection than about robustness.

We remove a rule to understand it

Trying the method without a filter, with nearby values or on another period helps us understand its contribution. We want the effect to remain explainable. If a condition matters only at one fitted value, we need a stronger reason to keep it.

Explore the technical detailOpen the full method, worked examples and implementation questions. We have kept this material here so you can follow the reasoning as far as you need.

Adding a filter feels responsible: remove weak trades and keep only the clean setups. The problem is that several filters may measure the same market behaviour with different labels, or may improve the past by removing too many difficult examples.

The right question is not “How many confirmations do we have?” but “What independent mistake does each filter prevent, and what does it cost?”

Field note · SHORT-05

A simple filter review

Test the contribution of each condition separately before keeping it.

  1. 01
    RoleName the exact failure the filter is intended to block.
  2. 02
    OverlapCheck whether another input already measures the same behaviour.
  3. 03
    CostMeasure delay, missed opportunities, and fewer independent samples.
  4. 04
    RobustnessRemove or shift the filter and repeat the test on unseen data.

Common mistake

A strategy keeps adding trend, momentum, volatility, session, and candle filters until its history looks smooth. Because several conditions were tuned together, no one knows which rule added real information and which one merely selected the past.

Practical check

Start with the smallest coherent model. Add one condition with a written purpose, compare opportunity count and behaviour, then challenge it on another period or feed. If removing it changes little, or nearby settings fail sharply, it may be complexity without durable value.

  • One filter, one stated purpose.
  • Measure overlap with existing inputs.
  • Track lost opportunities as well as avoided losses.
  • Retest on unseen data and nearby settings.
  • Prefer explainable improvement over a prettier curve.

Questions you may have

Do filters always reduce risk?

No. They can reduce some entries while adding delay, concentration, or false confidence.

How many filters should an EA use?

There is no universal number. Keep only conditions with distinct, testable roles.
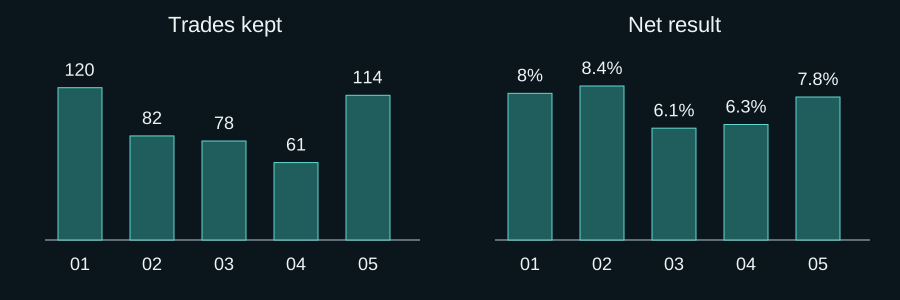
Measure what each filter adds after selection and cost

Scroll the diagram horizontally or open it at full size.

Measure what each filter adds after selection and cost
Educational design example — values and states are not live performance.

This constructed locked-period example starts with 120 trades. Filter A and B were defined before the period was opened; no parameters are refitted between rows. Returns are after the same stated costs.

01: Base

02: A: trend filter

03: B: volatility filter

04: A + B

05: Operational spread limit

Open full diagram ↗

Measure what each filter adds after selection and cost

This constructed locked-period example starts with 120 trades. Filter A and B were defined before the period was opened; no parameters are refitted between rows. Returns are after the same stated costs.

Ablation table — illustrative figures
Version Trades kept Net result Trades removed Interpretation
Base 120 +8.0% — Reference
A: trend filter 82 +8.4% 38 Small incremental benefit
B: volatility filter 78 +6.1% 42 Removes useful and poor trades
A + B 61 +6.3% 59 unique Large overlap; no added benefit over A
Operational spread limit 114 +7.8% 6 Lower return, but blocks orders beyond executable cost policy

If A removes 38 trades and B 42, but together remove only 59, then 21 removed trades overlap. Compare results on A-only, B-only, overlap and neither groups; a combined score alone cannot show interaction. Any refit after opening the locked period must be recorded as a new search and evaluated on a new untouched period.

B is statistically unhelpful in this example. The spread limit has a different purpose: it enforces an operating constraint even though it lowers the historical result. Predictive filters earn their place through stable incremental evidence; operational controls earn theirs by enforcing a declared safety or execution boundary.

What to verify

  • Record every filter and parameter version tried, including discarded ones.
  • Run leave-one-filter-out comparisons on a locked chronological period after identical costs.
  • Set separate retention criteria for predictive value and operational necessity.

Limits of this example

The figures show the evaluation method and are not performance evidence. A filter useful in one mechanism or regime may be harmful in another.

Editorial ownership and primary references

Reviewed by POLARIS Research

Evidence scope

This is an educational design and validation analysis. It explains testable failure modes; it is not evidence that a strategy will be profitable.

Primary references

These references support platform behaviour or research concepts. They do not validate POLARIS performance and do not guarantee future results.

Explore the next relevant layer

Move between focused research, system engineering and portfolio construction without losing the context of this page.

Contact POLARIS on WhatsApp