From our research notebook

Grid, Martingale and Hedging: Engineering the Guardrails

Our work with grid and hedging requests led us to focus on how exposure grows, how a basket ends and what happens when normal exits fail.

Grid, martingale and hedging appeared in different forms across our development work. The label alone told us little about the actual burden on an account. We had to follow the sequence of orders and ask how it would end if the market kept moving against it.

We followed the whole basket

Counting tickets could hide increasing size, floating loss, financing costs and margin use. We therefore looked at what the next order would add to the basket and how much capacity remained. Small closed profits do not explain the risk carried by positions that are still open.

We asked who could stop the sequence

A profit target answers only one part of the exit question. We also needed limits for loss, duration and abnormal conditions, together with a response to a failed close request. A hedge can change directional exposure while leaving costs, margin requirements and execution problems in place.

We carried that question into portfolio work

We examine prolonged one-way moves, gaps, wider spreads and interrupted operation because those situations challenge the sequence itself. At portfolio level, we also consider whether several systems could build similar baskets together. The detailed notes explain the safeguards without publishing a private entry or recovery method.

Explore the technical detailOpen the full method, worked examples and implementation questions. We have kept this material here so you can follow the reasoning as far as you need.

Grid, martingale and hedging requests appear often in automated-trading development. Our anonymized archive contains 33 projects in this broad family. The names can describe very different systems, but they share one engineering question: what happens when exposure grows while the market keeps moving against the original assumption?

The useful discussion is not whether a label is good or bad. It is whether the system makes exposure visible, defines an end to the sequence, and remains controllable when spread, margin, execution, or market behaviour becomes uncomfortable.

Engineering note · ENG-04

A safer order of design

The sequence begins with a fixed account boundary, not with the spacing between orders.

  1. 01
    LimitDefine the maximum permitted exposure, loss, margin use, and sequence length.
  2. 02
    MeasureRecalculate basket risk from current positions, costs, and actual broker conditions.
  3. 03
    ExitSpecify normal, time-based, risk-based, and emergency exits before entry.
  4. 04
    StopBlock new orders when data, liquidity, execution, or account conditions are unsafe.

Exposure first

A sequence can look calm while its open risk is accelerating. Lot progression, order distance, correlated symbols, swap, commission, and floating loss all affect the real burden. The EA should therefore calculate total basket exposure and remaining capacity before every new order, rather than relying on the number of open tickets alone.

Exit authority

A basket needs more than a profit target. It needs a maximum loss, a time boundary, a rule for abnormal spread or missing prices, and a clear answer when an order or close request fails. A hedge may change directional exposure, but it does not erase costs, margin use, execution risk, or the need for an exit.

Test the sequence

Normal backtests often understate the situations that matter most. Stress work should include wider costs, fewer fills, gaps, delayed execution, terminal restarts, and long one-sided moves. Nearby parameter sets should also be checked; a design that depends on one exact spacing or multiplier is difficult to trust.

Portfolio use

If a high-exposure method is used at all, its allocation should be judged by its worst credible basket behaviour, not by its normal month. It also needs portfolio-level limits so several systems cannot unknowingly build the same market exposure at once.

  • Cap money risk and margin use independently.
  • Define the final allowed order before the sequence starts.
  • Verify broker results; a requested close is not a completed close.
  • Pause on abnormal data, spread, liquidity, or execution.
  • Review combined account exposure, not only one EA.

Questions you may have

Does hedging remove risk?

No. It can alter directional exposure, but costs, margin, execution, correlation, and exit risk remain.

Can a grid be made safe?

No trading structure is risk-free. Clear caps and controlled exits can limit known exposure, but gaps, slippage, and abnormal conditions can still exceed intentions.
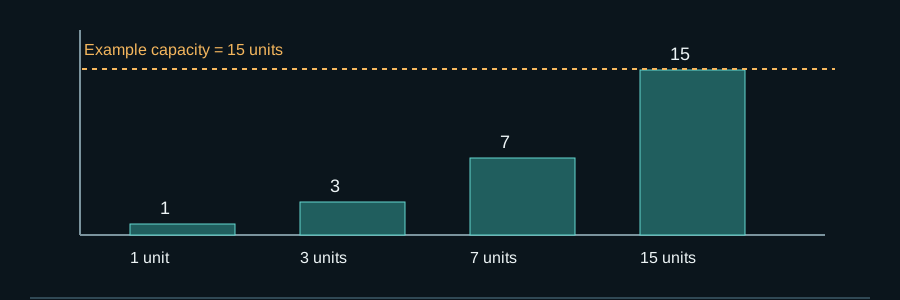
Calculate the path to the limit before relying on recovery

Scroll the diagram horizontally or open it at full size.

Calculate the path to the limit before relying on recovery
Educational design example — values and states are not live performance.

Order count: 1, 2, 3, 4. Cumulative exposure for a doubling sequence: 1, 3, 7, 15 units.

Open full diagram ↗

Calculate the path to the limit before relying on recovery

The table is a constructed EURUSD illustration: five BUY entries every 50 pips, starting at 1.1000, with a fixed 0.10 lot or a doubling sequence. It ignores swap and assumes $10 per pip per standard lot so the exposure mechanism stays visible. The mark price after level five is 1.0750, another 50 pips below the last entry.

Five-step exposure path — scenario, not a probability forecast
Level Entry Fixed cumulative lots / break-even Double cumulative lots / break-even Floating loss at 1.0750
1 1.1000 0.10 / 1.1000 0.10 / 1.1000 $250 / $250
2 1.0950 0.20 / 1.0975 0.30 / 1.0967 $450 / $650
3 1.0900 0.30 / 1.0950 0.70 / 1.0929 $600 / $1,250
4 1.0850 0.40 / 1.0925 1.50 / 1.0887 $700 / $2,050
5 1.0800 0.50 / 1.0900 3.10 / 1.0839 $750 / $2,850

Doubling moves the weighted break-even closer to price, but gross exposure becomes 3.10 lots—more than six times the fixed sequence. If price trends another 200 pips without returning, the approximate additional loss is $1,000 for fixed size and $6,200 for doubling, before spread and swap. A 100-pip gap adds about $500 versus $3,100. These are stress paths, not claims about their likelihood.

A hedge can reduce net direction while gross positions, margin, basis and exit risk remain. Margin answers whether positions can be held, not their stop or gap loss. Closing one side first can reopen direction; rejected or partial exits leave residual exposure. The row data has 33 records with grid/hedging as the main family, while the older hub’s broader theme shows 38. The unpublished membership map prevents a fuller reconciliation.

What to verify

  • Set maximum gross lots, sequence depth, basket loss, margin floor and duration before the first order.
  • Stress a one-way trend, a gap, wider spread, swap, rejected close and partial close.
  • At the cap, stop adding and define how remaining exposure is managed without assuming recovery.

Limits of this example

The break-even calculation is mechanical; it does not estimate market probability, liquidity at exit or account survival under every gap.

Editorial ownership and primary references

Reviewed by POLARIS Research

Evidence scope

This is an educational design and validation analysis. It explains testable failure modes; it is not evidence that a strategy will be profitable.

Primary references

These references support platform behaviour or research concepts. They do not validate POLARIS performance and do not guarantee future results.

Explore the next relevant layer

Move between focused research, system engineering and portfolio construction without losing the context of this page.

Contact POLARIS on WhatsApp