A smooth equity curve can create a strong first impression. It can also hide a simple weakness: if all capital depends on one Expert Advisor, the result still depends on one set of assumptions—one entry model, one exit logic, one preferred type of volatility and one way of handling execution.
At POLARIS, we treat each Expert Advisor much like an individual holding. It may be useful on its own, but it becomes part of a portfolio only when its role, risk and interaction with the other systems are understood. The objective is not to collect robots. It is to reduce dependence on any single market condition.
How systems become one portfolio
Different trading roles are selected first. A shared risk budget and ongoing portfolio monitoring then connect them into one coordinated structure.
- 01Directional logicParticipates when persistent movement is present.
- 02Counter-cycle logicResponds to controlled returns toward balance.
- 03Specialist logicTargets a distinct market or execution relationship.
- 04Risk budgetLimits each component before signals reach the account.
- 05Portfolio monitorReviews combined exposure, correlation, execution, and drift.
One dependency
Every trading system expresses a hypothesis about the market. A trend-following model expects continuation. A mean-reversion model expects price to return toward balance. An arbitrage system follows a relationship between connected markets. Each idea can work, but none of them describes every market environment.
This is why one profitable EA remains a concentrated exposure. If the conditions that support its logic disappear, the whole account can become dependent on the same weakness. A longer backtest may improve our understanding of that dependency, but it does not remove it.
Market seasons
Markets move through different regimes. Strong directional periods may favour a trend model. Quiet or balanced periods can suit a controlled mean-reversion approach. Changes in volatility, liquidity, spread or execution can also alter the behaviour of a system that previously looked stable.
The purpose of a multi-strategy forex portfolio is not to predict every change perfectly. It is to avoid asking one strategy to perform a job for which it was not designed. When one component reaches an unfavourable season, another independent component may respond differently—or simply remain inactive.
Different logic
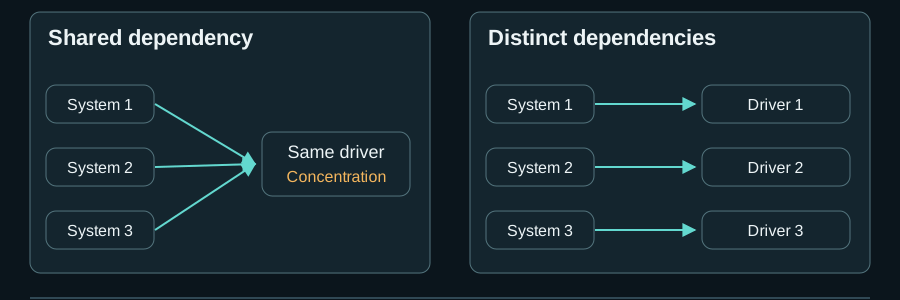
Two Expert Advisors are not necessarily diversified. They may have different names and parameters while still entering the same market, during the same session, for the same underlying reason. In stress, those similarities can appear as one large position rather than two independent ideas.
Useful diversification starts with the source of the decision. We look for systems that observe different information, react to different market behaviour or serve different roles. Directional, counter-cycle, price-structure, execution-based and confirmation layers can contribute something distinct. The internal rules remain proprietary, but the role of each component should be clear.
Risk first
Robot count is not a risk plan. Five systems can still create one concentrated exposure if they open together or depend on the same market movement. For this reason, allocation begins with a risk budget rather than an equal division of capital.
We consider the predefined risk of each position, daily and weekly safety limits, simultaneous exposure, shared market sensitivity and the way losses may overlap. A portfolio weight therefore describes expected contribution to risk—not a decorative percentage and not simply the number of robots assigned to an account.
Earn the role
A profitable result is only the beginning. A system must start from a logical market idea, survive long historical tests, respond reasonably across different data and broker conditions, and then face untouched out-of-sample data. Calibration is completed before that unseen test so later information cannot leak back into development.
Forward testing and practical market observation then show what a report cannot: spread, slippage, latency and real execution behaviour. Even after passing these stages, a system enters a portfolio only if it adds a role that the existing components do not already provide. Every system has to earn its place.
One structure
After selection, the work continues at portfolio level. We do not review each equity curve in isolation. We examine how the systems behave together, especially when the market becomes difficult.
- Correlation and simultaneous positions across systems
- Combined drawdown and the source of each loss
- Changes in spread, slippage, latency and execution quality
- Whether a system still behaves within its expected market role
- Behaviour drift that may justify reducing, pausing or removing a component
No guarantees
Diversification can reduce concentration; it cannot eliminate loss. Several systems may struggle at the same time, historical relationships can change and leveraged trading remains risky. A portfolio should therefore be judged by its method, evidence, limitations and risk controls—not by a promise of permanent profit.
For clarity, a POLARIS portfolio means a coordinated basket of algorithmic systems. It is not presented as a regulated pooled investment fund. Our work focuses on research, system validation, portfolio engineering and selected professional collaboration.
The practical difference
A single EA asks: “Can this strategy make money?” A portfolio asks a wider set of questions: “When should this system take risk, what does it add, how does it interact with the rest, and what happens when its preferred conditions disappear?”
That difference is the foundation of the POLARIS approach. We build portfolios around independent logic, defined risk and continuous review—not around the hope that one robot will work in every season.
Common questions
Is a group of profitable EAs automatically a diversified portfolio?
No. Several EAs may depend on the same market direction, session, volatility or execution condition. Diversification begins with independent logic and different portfolio roles.
Can an EA portfolio eliminate drawdown?
No. Diversification may reduce concentration and smooth some periods, but it cannot remove market, leverage or execution risk.
How does a system earn a place in a POLARIS portfolio?
It must pass a staged validation process and add a useful role that is not already provided by the existing components. Profitability alone is not enough.